Stock Market Outlook for November 1, 2021

The S&P 500 Index has averaged an increase of 2.2% in November over the past two decades with 80% of periods showing gains.
Â
Â
Â
*** Stocks highlighted are for information purposes only and should not be considered as advice to purchase or to sell mentioned securities.  As always, the use of technical and fundamental analysis is encouraged in order to fine tune entry and exit points to average seasonal trends.
Stocks Entering Period of Seasonal Strength Today:
Subscribers – Click on the relevant link to view the full profile. Not a subscriber? Signup here.
First Majestic Silver Corp. (TSE:FR.TO) Seasonal Chart
Celestica, Inc. (TSE:CLS.TO) Seasonal Chart
Century Aluminum Co. (NASD:CENX) Seasonal Chart
Alamo Group, Inc. (NYSE:ALG) Seasonal Chart
AMN Healthcare Services, Inc. (NYSE:AMN) Seasonal Chart
Waddell & Reed Financial Inc. (NYSE:WDR) Seasonal Chart
Zoetis Inc. (NYSE:ZTS) Seasonal Chart
Invesco Dynamic Pharmaceuticals ETF (NYSE:PJP) Seasonal Chart
Vanguard S&P 500 ETF (NYSE:VOO) Seasonal Chart
Â
Â
The Markets
Stocks closed marginally higher on Friday, capping off a very strong month of October as major benchmarks erased the loss that was generated in the month prior. The S&P 500 Index closed higher by just less than two-tenths of one percent, inching above psychological resistance at 4600. Short-term momentum in the market is showing early signs of waning as portfolio manages re-shuffle their books ahead of the new month that starts on Monday. The short-term 20-day moving average has crossed back above its intermediate-term 50-day, both of which are in positions to support this market should the market consolidate its gains in the near-term.
For the month, the large-cap benchmark posted a return of an impressive 6.91%, significantly above the 1.1% gain that has been the norm for this first month of the fourth quarter over the past two decades. The benchmark found support at the upper limit of the previously broken rising long-term trend-channel, which was tested at the end of September. While momentum indicators are rolling over from overbought territory, they continue to show characteristics of a long-term bull market trend, a status that they have maintained since 2010. While the benchmark is significantly stretched above major moving averages, it would be pure speculation to entertain when the test of these variable hurdles will be realized. For now, the path of least resistance is obviously higher and, therefore, we must continue to be exposed to stocks, so long as the fundamental backdrop in the economy permits.
For the month ahead, the S&P 500 has averaged an increase of 2.2% in November over the past two decades with 80% of periods showing gains. This is the second best return and frequency combination of the year, lagging only the stellar results that are normal for the month of April. We break down everything that is relevant for the month ahead in our just released monthly report for November, which was emailed to subscribers mid-day on Friday. We have also uploaded this report to the archive, in full and by section, accessible via https://charts.equityclock.com/

Just Released…
Our Monthly report for November has just been sent to subscribers, highlighting everything that you should know from a seasonal, fundamental, and technical perspective for the month ahead.
Highlights in this report include:
- Equity market tendencies in the month of November
- Rejuvenation of breadth following the summer consolidation
- Broad equity market strength
- Breakdown in bonds relative to stocks, confirming our bias towards the latter
- Cyclical bent
- Industrial production and the impact from Hurricane Ida
- Manufacturer sentiment
- Manufacturer employment flourishing
- Workers quitting at a rapid pace, a positive for the health of the labor market
- Time to shift focus to smaller cap stocks
- Mid-Caps
- High Beta vs Low Volatility
- Interesting juncture for the technology sector
- Bond yields reaching back towards the highs of the year
- Tracking the spread of COVID
- Pharmaceuticals
- Health Care Providers
- Seasonal trade in retail stocks with the upcoming holiday spending period
- Demand for energy products during the historically slower time of the year for driving activity
- The derivative trade to high energy prices
- Existing Home Sales
- Average equity market performance during the second year of a recovery
- The technical status of the S&P 500 Index
- Seasonal decline in volatility into the end of the year
- Positioning for the months ahead
- Sector reviews and ratings
- Stocks that have frequently gained in the month of November
- Notable stocks and ETFs entering their period of strength in November
Look for this 119-page report in your inbox.
Subscribe now and we’ll send this outlook to you.
With the new month upon us and as we celebrate the release of our monthly report for November, today we release our screen of all of the stocks that have gained in every November over their trading history. While we at Equity Clock focus on a three-pronged approach (seasonal, technical, and fundamental analysis) to gain exposure to areas of the market that typically perform well over intermediate (2 to 6 months) timeframes, we know that stocks that have a 100% frequency of success for a particular month is generally of interest to those pursuing a seasonal investment strategy. Below are the results:
And how about those securities that have never gained in this eleventh month of the year, here they are:
*Note: Aside from Emerson Electric (EMR), none of the results highlighted above have the 20 years of data that we like to see in order to accurately gauge the annual recurring, seasonal influences impacting an investment, therefore the reliability of the results should be questioned. We present the above list as an example of how our downloadable spreadsheet available to yearly subscribers can be filtered.
Today, in our Market Outlook to subscribers, we discuss the following:
- Canada GDP and what is driving economy activity
Subscribe now and we’ll send this outlook to you.
Sentiment on Friday, as gauged by the put-call ratio, ended bullish at 0.88.
Â
Â
Â
Â
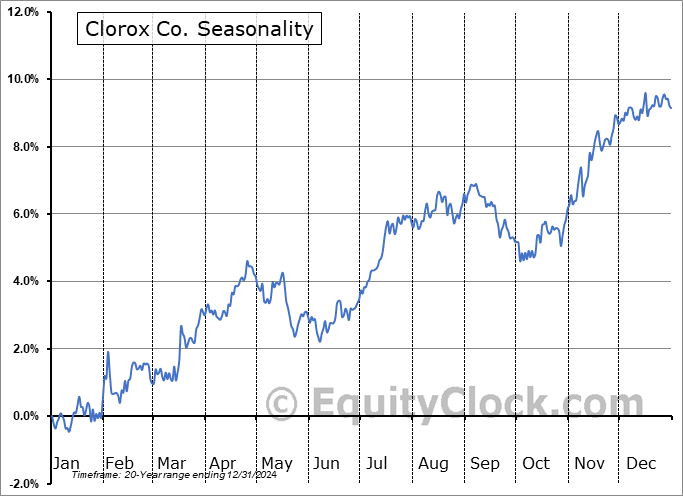
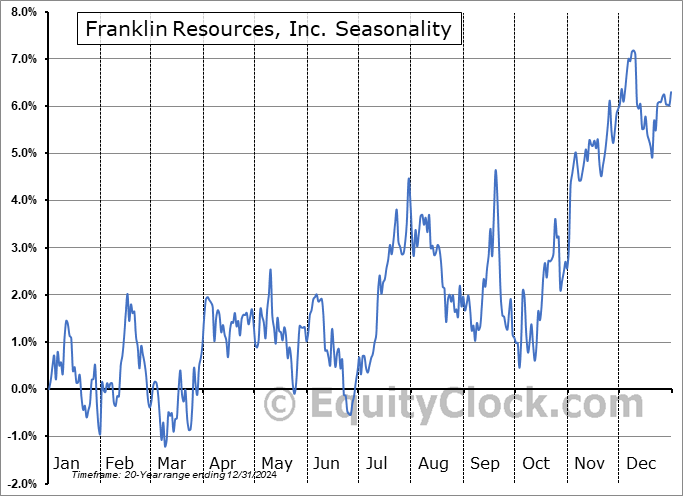
Seasonal charts of companies reporting earnings today:
Â
Â
S&P 500 Index
Â
Â
TSE Composite
| Sponsored By... |

|


