Stock Market Outlook for March 7, 2022

Geopolitical headlines overshadowed a rather goldilocks employment report for February.
*** Stocks highlighted are for information purposes only and should not be considered as advice to purchase or to sell mentioned securities. As always, the use of technical and fundamental analysis is encouraged in order to fine tune entry and exit points to average seasonal trends.
Stocks Entering Period of Seasonal Strength Today:
Subscribers – Click on the relevant link to view the full profile. Not a subscriber? Signup here.
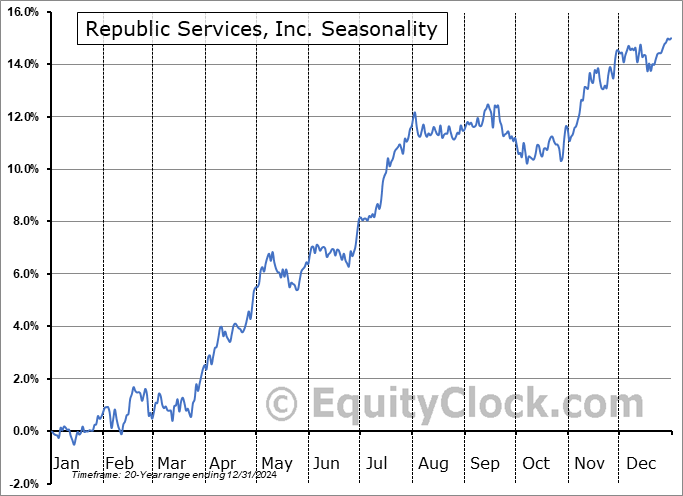
Republic Services, Inc. (NYSE:RSG) Seasonal Chart

Emera Inc. (TSE:EMA.TO) Seasonal Chart

Harsco Corp. (NYSE:HSC) Seasonal Chart

Titan Intl, Inc. (NYSE:TWI) Seasonal Chart

W.P. Carey and Co. Llc (NYSE:WPC) Seasonal Chart

Box, Inc. (NYSE:BOX) Seasonal Chart

Ferrari NV (NYSE:RACE) Seasonal Chart

First Trust NASDAQ Cybersecurity ETF (NASD:CIBR) Seasonal Chart

Lululemon Athletica Inc. (NASD:LULU) Seasonal Chart
The Markets
Stocks closed lower for another day as heightened geopolitical risks continue to stand in the way of equity markets elevating off of levels of support. The S&P 500 Index closed down by eight-tenths of one percent, remaining stuck to levels above significant support at 4280. Short-term resistance continues to be defined by the declining 20-day moving average, now around 4400 and momentum indicators are showing signs of rolling over from their recent climb. Despite the positive momentum divergences in both RSI and MACD in the past month and a half, suggesting waning selling pressures, they remain below their middle lines, which is a characteristic of a bearish trend. We continue to peg our equity allocation off of significant support on the large-cap benchmark at 4280, which is about the best that we can do, from an overall perspective, while we digest the headline risks as they materialize.

Today, in our Market Outlook to subscribers, we discuss the following:
- Weekly look at the large-cap benchmark
- Looking for our next shot at ramping up risk and the rotation that is appropriate ahead
- The parabolic decline of stocks outside of the US
- US Employment report and the themes contained within
Subscribe now and we’ll send this outlook to you.
Sentiment on Friday, as gauged by the put-call ratio, ended close to neutral at 0.95.

Seasonal charts of companies reporting earnings today:


S&P 500 Index


TSE Composite


| Sponsored By... |

|

