Stock Market Outlook for May 12, 2022

Mega-cap tech names encompassing around 20% of the weight of the S&P 500 Index have just broken below levels of support, leading to a further deterioration of market breadth.
*** Stocks highlighted are for information purposes only and should not be considered as advice to purchase or to sell mentioned securities. As always, the use of technical and fundamental analysis is encouraged in order to fine tune entry and exit points to average seasonal trends.
Stocks Entering Period of Seasonal Strength Today:
Subscribers – Click on the relevant link to view the full profile. Not a subscriber? Signup here.
USANA Health Sciences, Inc. (NYSE:USNA) Seasonal Chart
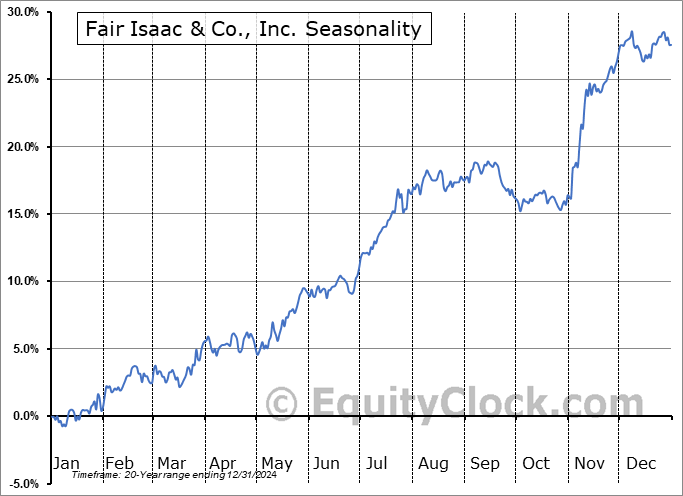
Fair Isaac & Co., Inc. (NYSE:FICO) Seasonal Chart
Inseego Corp. (NASD:INSG) Seasonal Chart
Regional Management Corp. (NYSE:RM) Seasonal Chart
Etsy Inc. (NASD:ETSY) Seasonal Chart
Direxion Daily 20+ Year Treasury Bull 3x Shares (NYSE:TMF) Seasonal Chart
The Markets
Stocks continued to struggle through the Wednesday session as a hotter than expected read of inflation once again sent jitters through the market over how aggressive the Fed will have to be to normalize monetary policy. The S&P 500 Index ended down by 1.65%, continuing to make progress towards the target suggested by the head-and-shoulders topping pattern of 3780. This target is now just a mere 155 points away, which could easily become fulfilled in a matter of days. The relative strength index (RSI) is nearing oversold territory, a classification that would likely begin the bottoming process to the first half of the year weakness in the market. Major moving averages continue to point lower, indicating negative trends across multiple timeframes. We don’t have indication yet that the market has reached a significant low, but we expect that we are quickly closing in on one, which would allow us to become reinvigorated in stocks again. For now, our lofty cash/bond exposure remains very comforting amidst this final phase of the market sell-off, which we have characterized as the “sell everything” market.
Today, in our Market Outlook to subscribers, we discuss the following:
- The breakdown of mega-cap tech
- Bond prices moving higher despite concerns pertaining to the normalization of monetary policy
- The change we are enacting in the Super Simple Seasonal Portfolio
- US Consumer Price Index (CPI) and what is driving the trend of inflationary pressures
- Weekly petroleum inventories and the state of demand
Subscribe now and we’ll send this outlook to you.
Sentiment on Wednesday, as gauged by the put-call ratio, ended bearish at 1.13.
Seasonal charts of companies reporting earnings today:
S&P 500 Index
TSE Composite
| Sponsored By... |

|


