Stock Market Outlook for May 13, 2022

Indications are materializing that the market is preparing itself to rally.
*** Stocks highlighted are for information purposes only and should not be considered as advice to purchase or to sell mentioned securities. As always, the use of technical and fundamental analysis is encouraged in order to fine tune entry and exit points to average seasonal trends.
Stocks Entering Period of Seasonal Strength Today:
Subscribers – Click on the relevant link to view the full profile. Not a subscriber? Signup here.

RH (NYSE:RH) Seasonal Chart

Global Water Resources Inc. (NASD:GWRS) Seasonal Chart
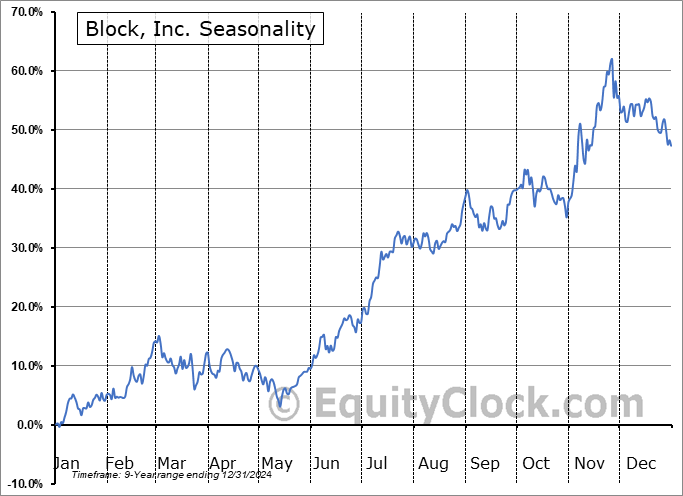
Square, Inc. (NYSE:SQ) Seasonal Chart

Innovator IBD 50 Fund (AMEX:FFTY) Seasonal Chart

Eaton Vance Tax-Managed Global Buy-Write Opportunities Fund (NYSE:ETW) Seasonal Chart

Simon Property Group, Inc. (NYSE:SPG) Seasonal Chart

Lions Gate Entertainment Corp. (NYSE:LGF/A) Seasonal Chart

Altus Group Ltd. (TSE:AIF.TO) Seasonal Chart

Under Armour, Inc. (NYSE:UAA) Seasonal Chart

Skyworks Solutions Inc. (NASD:SWKS) Seasonal Chart

Algonquin Power & Utilities Corp. (TSE:AQN.TO) Seasonal Chart

SPDR S&P Software & Services ETF (NYSE:XSW) Seasonal Chart

Invesco India ETF (NYSE:PIN) Seasonal Chart
The Markets
Stocks struggled again as the breakdown in mega-cap tech realized on Wednesday unleashed a new wave of selling pressures through the middle of Thursday’s session. The S&P 500 Index shed just over a tenth of one percent, charting a rather indecisive doji candlestick. The benchmark is rapidly closing in on the downside target implied of the head-and-shoulders topping pattern at 3780. At the lows of the day, we got to around 80 points from this hurdle. While a perfect test and bounce from this target would obviously be desired, in our process, trajectory and momentum takes precedence over targets. A low anywhere within a 100-point range around this hurdle, which was seen on Thursday, would, in our opinion, be a bull’s-eye, but we must wait for indication that downside momentum is fading before we can become enticed to take a stab at the long side of stocks.

Today, in our Market Outlook to subscribers, we discuss the following:
- A look at the trend of the large-cap benchmark on the hourly chart
- The stall in the trajectory of the VIX
- Some of the riskiest segments of the market rebounding sharply
- CASS Freight Index and the state of shipping activity in the economy
- Dow Jones Transportation Average piercing horizontal support
- Natural Gas Inventories and the seasonal trade in the commodity
Subscribe now and we’ll send this outlook to you.
Sentiment on Thursday, as gauged by the put-call ratio, ended bearish at 1.26.

Seasonal charts of companies reporting earnings today:


S&P 500 Index


TSE Composite


| Sponsored By... |

|

