Stock Market Outlook for December 1, 2022

Real Time Economic Calendar provided by Investing.com.
*** Stocks highlighted are for information purposes only and should not be considered as advice to purchase or to sell mentioned securities. As always, the use of technical and fundamental analysis is encouraged in order to fine tune entry and exit points to average seasonal trends.
Stocks Entering Period of Seasonal Strength Today:
Subscribers – Click on the relevant link to view the full profile. Not a subscriber? Signup here.
BMO Mid-Term US IG Corporate Bond Hedged to CAD Index ETF (TSE:ZMU.TO) Seasonal Chart
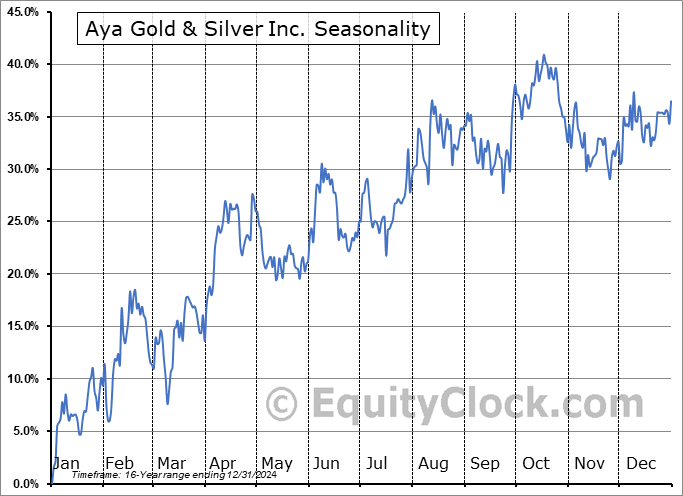
Aya Gold & Silver Inc. (TSE:AYA.TO) Seasonal Chart

Mackenzie Unconstrained Bond ETF (TSE:MUB.TO) Seasonal Chart

Global X SuperDividend Emerging Markets ETF (AMEX:SDEM) Seasonal Chart

Schwab U.S. REIT ETF (NYSE:SCHH) Seasonal Chart

iShares MSCI Global Metals & Mining Producers ETF (AMEX:PICK) Seasonal Chart

iShares Core International Aggregate Bond ETF (AMEX:IAGG) Seasonal Chart

Invesco Total Return Bond ETF (AMEX:GTO) Seasonal Chart

iShares Interest Rate Hedged Corporate Bond ETF (AMEX:LQDH) Seasonal Chart

TAL Education Group (NYSE:TAL) Seasonal Chart

iShares Global Clean Energy ETF (NASD:ICLN) Seasonal Chart

Cambria Global Asset Allocation ETF (AMEX:GAA) Seasonal Chart

Valero Energy Corp (NYSE:VLO) Seasonal Chart
The Markets
Stocks surged higher on Wednesday following signals that the Fed would be less aggressive in its monetary policy tightening path moving forward. The S&P 500 Index rebounded from recent weakness to close higher by an impressive 3.09%, moving above the 200-day moving average for the first time since March. In an instant, the benchmark has closed the downside open gap that was charted in September between 4037 and 4083, a zone that presented significant resistance over the past 12 weeks. Declining trendline resistance just below 4100 is now the test, a hurdle that will either make or break the declining path the benchmark has been on this year. As has been highlighted in recent reports, short-term bullish setups presented by way of a bull-flag and a cup-and-handle pattern projects an upside target to 4200, which, if realized, would see declining trendline resistance violated. Horizontal support at 3900 and the convergence of moving averages (eg. 20, 100, and 150-day) just above the horizontal hurdle present a solid point of support to the ongoing rising short-term trend heading into another seasonally strong month of December.
Looking ahead, the large-cap benchmark averages further strength to close the fourth quarter and the year overall. The S&P 500 Index has averaged a return of 0.9% for December over the past two decades with an strong 70% of periods ending positive. Returns have ranged from a loss of 9.2% in December of 2018 to a gain of 6.5% in December of 2010. We breakdown everything that you need to know in our just released Monthly Outlook for December. Signup now to receive this report.Today, in our Market Outlook to subscribers, we discuss the following:
Subscribers can look for this report in their inbox or by clicking on the following link and logging in: Market Outlook for December 1 Not signed up yet? Subscribe now to receive full access to all of the research and analysis that we publish.
- A look at the monthly chart of the large-cap benchmark
- Average performance of stocks in December
- Stocks that have gained or lost in every December over their trading history
- Job Openings and Labor Turnover Survey (JOLTs)


With the new month upon us and as we celebrate the release of our monthly report for December, today we release our screen of all of the stocks that have gained in every December over their trading history. While we at Equity Clock focus on a three-pronged approach (seasonal, technical, and fundamental analysis) to gain exposure to areas of the market that typically perform well over intermediate (2 to 6 months) timeframes, we know that stocks that have a 100% frequency of success for a particular month is generally of interest to those pursuing a seasonal investment strategy. Below are the results:Just released…
Our monthly report for December is out, providing you with all of the insight that you require to navigate the month ahead and also to set you up for what could be another tough year for stocks in 2023. Highlights in this report include:Subscribers can look for this report in their inbox or in the report archive at https://charts.equityclock.com/. Not subscribed yet? Signup now to receive this and all of the content that we publish.
- Equity market tendencies in the month of December
- Volatility coming down, conducive to maintaining the rising short-term trend of stocks
- Declining path of high yield spreads
- Pre-Election Year Tendencies for Stocks under a split congress
- Average performance of stocks during recessionary years
- Using the path of the market during the 1981/82 recession as a guide for stocks moving forward
- Average performance of Gold during recessionary years
- Inverted Yield Curve Nothing to Fear, Yet
- Breakdown in yields/breakout in bond prices
- Inflationary pressures showing no significant signs of alleviating
- Retail sales suggest that sales of discretionary goods are falling off as sales of necessities remain strong
- Housing market is still crumbling, but reason to be constructive of the stocks may still exist
- Time to rotate to Canadian equities?
- US Dollar
- Market Breadth
- Technology burden on the market
- Countries less exposed to technology breaking out
- Our list of Industries noted with an Accumulate rating in our weekly chart books, along with relevant ETFs
- Positioning for the months ahead
- Sector Reviews and Ratings
- Stocks that have Frequently Gained in the Month of December
- Notable Stocks and ETFs Entering their Period of Strength in December
 And how about those securities that have never gained in this last month of the year, here they are:
 Sentiment on Wednesday, as gauged by the put-call ratio, ended overly bearish at 1.27.
 Seasonal charts of companies reporting earnings today:
 Seasonal Chart")


 Seasonal Chart")


S&P 500 Index


TSE Composite


| Sponsored By... |

|

