Stock Market Outlook for January 31, 2023

*** Stocks highlighted are for information purposes only and should not be considered as advice to purchase or to sell mentioned securities. As always, the use of technical and fundamental analysis is encouraged in order to fine tune entry and exit points to average seasonal trends.
Stocks Entering Period of Seasonal Strength Today:
Subscribers – Click on the relevant link to view the full profile. Not a subscriber? Signup here.
Century Communities, Inc. (NYSE:CCS) Seasonal Chart
Ero Copper Corp. (NYSE:ERO) Seasonal Chart
SPDR S&P Insurance ETF (NYSE:KIE) Seasonal Chart
Intl Flavors & Fragrances (NYSE:IFF) Seasonal Chart
Tourmaline Oil Corp. (TSE:TOU.TO) Seasonal Chart
Zoetis Inc. (NYSE:ZTS) Seasonal Chart
Teledyne Technologies (NYSE:TDY) Seasonal Chart
Polaris Inds, Inc. (NYSE:PII) Seasonal Chart
Tyson Foods Inc Cl A (NYSE:TSN) Seasonal Chart
The Markets
Stocks dipped on Monday as investors took down some risk ahead of the FOMC meeting on Tuesday/Wednesday. The S&P 500 Index ended the session with a loss of 1.30%, peeling back towards declining trendline resistance that was broken in the past week. Horizontal resistance at the December high of 4100 remains intact, keeping the trajectory of lower-highs from the past year intact. Momentum indicators are showing early signs of rolling over below declining trendline resistance in what has become a narrowing range over a number of months, defining a rather neutral momentum backdrop. The 50-day moving average seems poised to cross above its declining 200-day moving average in what is referred to as a golden cross, but, as has been pointed out in recent reports, the timeliness of this technical event as an immediate buy or sell indicator is typically quite poor, implying that buying the near-term crossover may be inopportune. Seasonally, stocks remain in a soft period into the start of March.
Want to know which areas of the market to buy or sell? Our Weekly Chart Books have just been updated, providing a clear Accumulate, Avoid, or Neutral rating for currencies, cryptocurrencies, commodities, broad markets, and subsectors/industries of the market. Subscribers can login and click on the relevant links to access.
- Currencies
- Cryptocurrencies
- Commodities
- Major Benchmarks
- Sub-sectors / Industries
- ETFs: Bonds | Commodities | Equity Markets | Industries | Sectors
Subscribe now.
Today, in our Market Outlook to subscribers, we discuss the following:
- Ratings changes in this week’s chart books
- Our list of segments of the market to Accumulate or Avoid
- Defensive sectors showing some of the worst charts
- Breakout of the High-Beta ETF (SPHB)
- Logical point for a risk-aversion move to materialize
Subscribers can look for this report in their inbox or by clicking on the following link and logging in: Market Outlook for January 31
Not signed up yet? Subscribe now to receive full access to all of the research and analysis that we publish.
Sentiment on Monday, as gauged by the put-call ratio, ended bullish at 0.91.
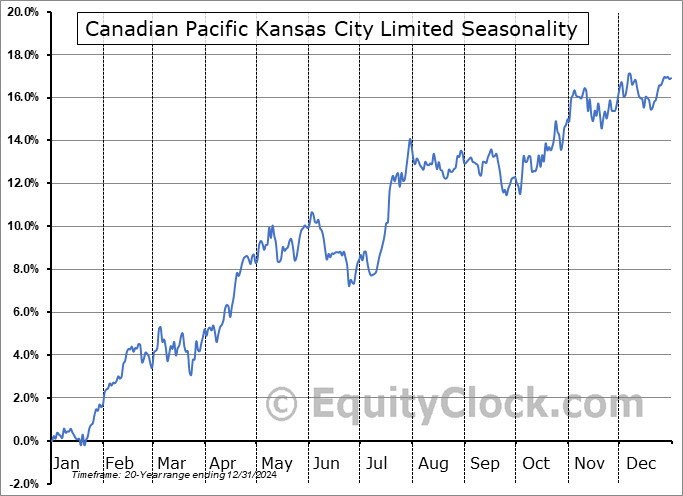
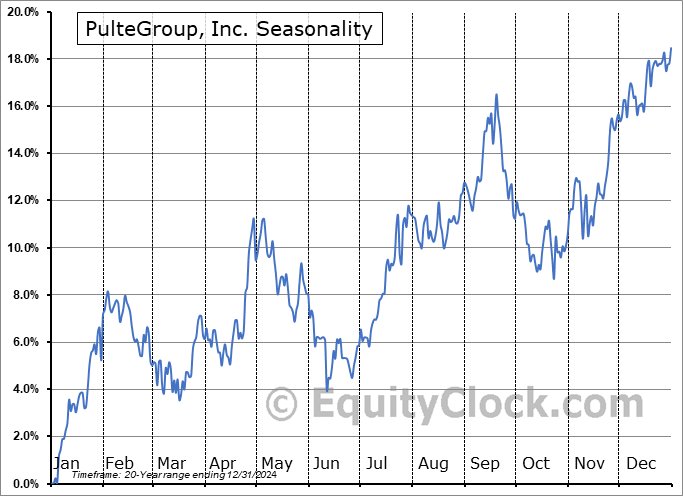
Seasonal charts of companies reporting earnings today:
S&P 500 Index
TSE Composite
| Sponsored By... |

|


