Stock Market Outlook for March 1, 2023

Real Time Economic Calendar provided by Investing.com.
*** Stocks highlighted are for information purposes only and should not be considered as advice to purchase or to sell mentioned securities. As always, the use of technical and fundamental analysis is encouraged in order to fine tune entry and exit points to average seasonal trends.
Stocks Entering Period of Seasonal Strength Today:
Subscribers – Click on the relevant link to view the full profile. Not a subscriber? Signup here.
Quest Diagnostics Inc. (NYSE:DGX) Seasonal Chart

Nisource, Inc. (NYSE:NI) Seasonal Chart

Cadence Design Systems, Inc. (NASD:CDNS) Seasonal Chart
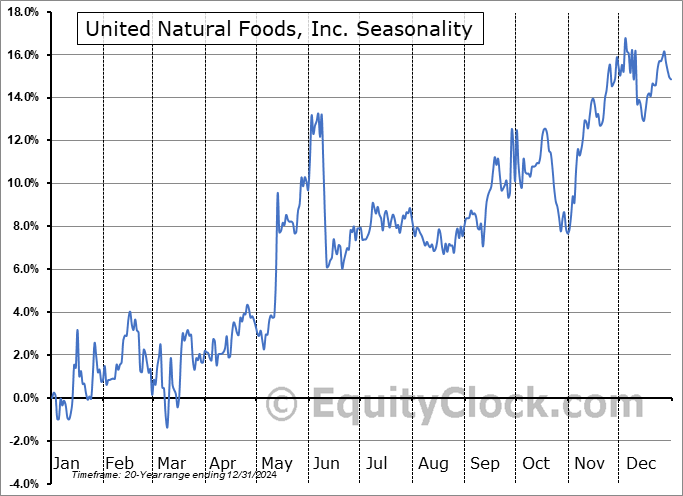
United Natural Foods, Inc. (NYSE:UNFI) Seasonal Chart
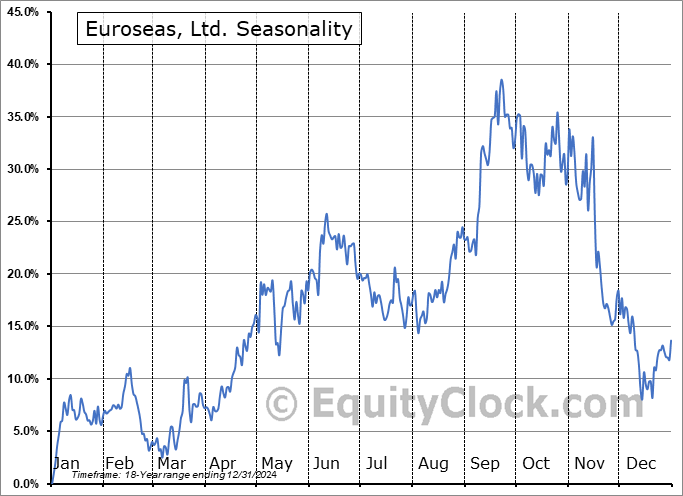
Euroseas, Ltd. (NASD:ESEA) Seasonal Chart

Globe Life Inc. (NYSE:GL) Seasonal Chart

Healthcare Leaders Income ETF (TSE:HHL.TO) Seasonal Chart

Invesco DWA Utilities Momentum ETF (NASD:PUI) Seasonal Chart
The Markets
Stocks drifted lower in the final session of February as ongoing dollar strength burdened risk assets. The S&P 500 Index closed lower by three-tenths of one percent, slipping back below its rising 50-day moving average. Consecutive long upper and lower-wick candlesticks charted in recent days highlights the tenuous state of the benchmark heading into the new month, a period that investors will be seeking clarity as to the Fed’s next actions. A confluence of support presented by major moving remains in a position to backstop the market in the near-term between 3900 and 4000, a break of which would entertain a much more bearish view of the market, away from the Neutral bias that we continue to maintain. Momentum sell signals remain intact following the bearish MACD crossover charted two and a half weeks ago and the short-term trend is negative, as depicted by the declining 20-day moving average.
Today, in our Monthly Outlook to subscribers, we discuss the following:
Subscribers can look for this report in their inbox or by clicking on the following link and logging in: Market Outlook for March 1 Not signed up yet? Subscribe now to receive full access to all of the research and analysis that we publish.
- Monthly look at the large-cap benchmark
- Tendencies for the month of March
- Securities that have always gained or lost in the third month of the year
- Case-Shiller Home Price Index
- Canada Gross Domestic Product (GDP)
With the new month upon us and as we celebrate the release of our monthly report for March, today we release our screen of all of the stocks that have gained in every March over their trading history. While we at Equity Clock focus on a three-pronged approach (seasonal, technical, and fundamental analysis) to gain exposure to areas of the market that typically perform well over intermediate (2 to 6 months) timeframes, we know that stocks that have a 100% frequency of success for a particular month is generally of interest to those pursuing a seasonal investment strategy. Below are the results:Just released…
Our 102-page monthly report for March is out, providing you with everything that you need to know for the month(s) ahead. Highlights in this report include:Subscribers can look for this report in their inbox. Not subscribed yet? Signup now to receive this and other reports that we publish on either a daily or monthly basis, providing insight on how to position your portfolio according to our three pronged approach.
- Equity market tendencies in the month of March
- The decline in global central bank liquidity has taken a pause
- Elevated use of the Fed’s Repo facility gives future ammunition to the market
- Bears betting on an earnings recession to take down stocks, but not all companies are on a declining path
- Abnormally mild winter temperatures supporting the labor market early in 2023
- Weather and evolving seasonality significant factors behind early year strength in retail sales
- Abnormally mild winter weather fuels strength in industrial production, but an abnormal decline in utility production
- Manufacturers highly pessimistic of economic activity moving forward
- Waning business and consumer demand burdening shipping activity
- Baltic Dry Index down 90% from its pandemic peak
- Inflation problem in the economy has not gone away
- A dip in consumer loans to start the year
- The shift of the trend of delinquencies
- Major benchmarks struggling at last year’s breakdown points
- Dollar and Yields still key to the direction of stocks
- Break of the declining trend of the Volatility Index (VIX)
- Our list of all segments of the market to either Accumulate or Avoid, along with relevant ETFs
- Positioning for the months ahead
- Sector Reviews and Ratings
- Stocks that have Frequently Gained in the Month of March
- Notable Stocks and ETFs Entering their Period of Strength in March
 And how about those securities that have never gained in this third month of the year, here they are:
 *Note: None of the results highlighted above have the 20 years of data that we like to see in order to accurately gauge the annual recurring, seasonal influences impacting an investment, therefore the reliability of the results should be questioned. We present the above list as an example of how our downloadable spreadsheet available to yearly subscribers can be filtered.
Sentiment on Tuesday, as gauged by the put-call ratio, ended bearish at 1.02.
*Note: None of the results highlighted above have the 20 years of data that we like to see in order to accurately gauge the annual recurring, seasonal influences impacting an investment, therefore the reliability of the results should be questioned. We present the above list as an example of how our downloadable spreadsheet available to yearly subscribers can be filtered.
Sentiment on Tuesday, as gauged by the put-call ratio, ended bearish at 1.02.
 Seasonal charts of companies reporting earnings today:


 Seasonal Chart")


S&P 500 Index


TSE Composite


| Sponsored By... |

|

