Stock Market Outlook for April 12, 2023

Wholesaler inventories are in decline through the first two months of this year, reminiscent of recessionary downturns in the economy over the past 25 years.
*** Stocks highlighted are for information purposes only and should not be considered as advice to purchase or to sell mentioned securities. As always, the use of technical and fundamental analysis is encouraged in order to fine tune entry and exit points to average seasonal trends.
Stocks Entering Period of Seasonal Strength Today:
Subscribers – Click on the relevant link to view the full profile. Not a subscriber? Signup here.

Fidelity MSCI Information Technology Index ETF (AMEX:FTEC) Seasonal Chart

ATS Corporation (TSE:ATS.TO) Seasonal Chart

Natera, Inc. (NASD:NTRA) Seasonal Chart

Invesco S&P SmallCap 600 Pure Growth ETF (NYSE:RZG) Seasonal Chart
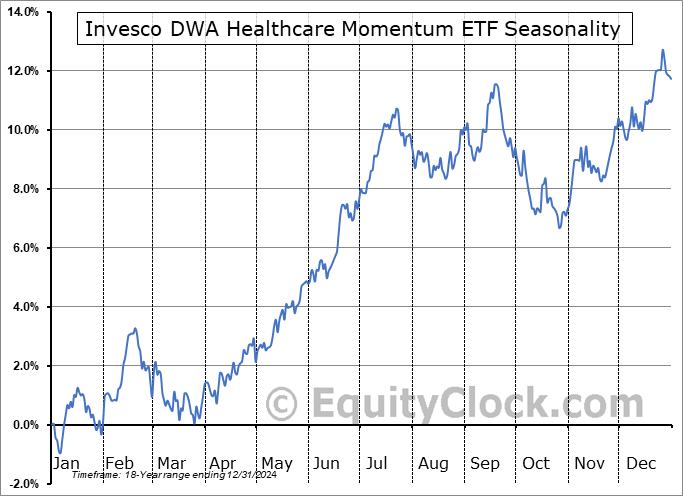
Invesco DWA Healthcare Momentum ETF (NASD:PTH) Seasonal Chart

Veeva Systems Inc. (NYSE:VEEV) Seasonal Chart
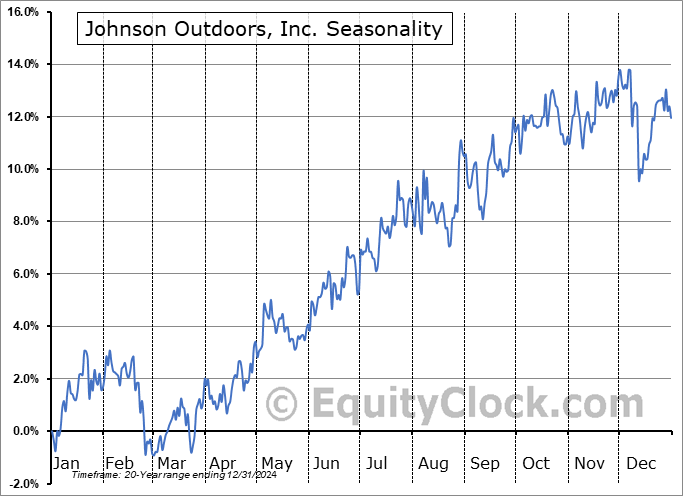
Johnson Outdoors, Inc. (NASD:JOUT) Seasonal Chart

Globalstar Inc. (AMEX:GSAT) Seasonal Chart

Strategic Education, Inc. (NASD:STRA) Seasonal Chart
The Markets
Stocks closed flat on Tuesday as investors await the pivotal Consumer Price Index report on Wednesday. The S&P 500 Index was unchanged on the day, continuing to show reaction to the range of overhead resistance between 4100 and 4200. Signs of waning upside momentum continue to be seen with the MACD histogram pulling back as the technical indicator converges on its signal line. Altogether, an upside catalyst certainly seems required in order to keep the rising intermediate trajectory the stems from the low set in October intact. There remains a few more weeks left in the best six month trend for stocks that began in October, therefore the timing of any upside move from here is becoming increasingly limited before the off-season for risk (stocks) starts in May. As we have been suggesting, there remains segments of this market that are worthy to Accumulate and those to Avoid (see our weekly chart books), regardless of what the broad benchmark does from here, but these next few week are suspected to be the last period of relative stability for stocks before the volatility attributed to a recessionary downturn gets underway.

Today, in our Market Outlook to subscribers, we discuss the following:
- Quality factor ETF (QUAL)
- The reversal of the Fed’s balance sheet unwind following the implementation of the emergency lending program
- Wholesale inventories
Subscribers can look for this report in their inbox or by clicking on the following link and logging in: Market Outlook for April 12
Not signed up yet? Subscribe now to receive full access to all of the research and analysis that we publish.
Sentiment on Tuesday, as gauged by the put-call ratio, ended slightly bearish at 1.03.

Seasonal charts of companies reporting earnings today:


S&P 500 Index


TSE Composite


| Sponsored By... |

|

