Stock Market Outlook for July 28, 2023

As the extreme heat increases the demand of electricity for cooling purposes, Natural gas stockpiles just recorded one of its smallest injections for the month of July on record.
*** Stocks highlighted are for information purposes only and should not be considered as advice to purchase or to sell mentioned securities. As always, the use of technical and fundamental analysis is encouraged in order to fine tune entry and exit points to average seasonal trends.
Stocks Entering Period of Seasonal Strength Today:
Subscribers – Click on the relevant link to view the full profile. Not a subscriber? Signup here.
CBOE Global Markets Inc. (AMEX:CBOE) Seasonal Chart
Compass Diversified Holdings (NYSE:CODI) Seasonal Chart
Telus Corp. (NYSE:TU) Seasonal Chart
Invesco Canadian Dividend Index ETF (TSE:PDC.TO) Seasonal Chart
Invesco S&P SmallCap 600 Pure Value ETF (NYSE:RZV) Seasonal Chart
BMO MSCI USA High Quality Index ETF (TSE:ZUQ.TO) Seasonal Chart
BMO US Put Write ETF (TSE:ZPW.TO) Seasonal Chart
BMO US High Dividend Covered Call ETF (TSE:ZWH.TO) Seasonal Chart
Quarterhill Inc. (TSE:QTRH.TO) Seasonal Chart
The Markets
Stocks closed generally lower on Thursday as a jump in yields and strength in the US Dollar pressured risk assets. The S&P 500 Index ended the day down by just less than two-thirds of one percent, charting an outside reversal candlestick after the benchmark hit our proposed target for the summer rally of 4600 earlier in the day. The bearish engulfing candlestick is derived by an open higher than the previous day’s high and a close lower than the prior session’s low, signalling buying exhaustion precisely at this hurdle that we had been targeting since the breakout above previous significant horizontal resistance at 4200. The reversal session resulted in a bearish crossover with respect to MACD, which has been showing a divergence versus price for some time, highlighting the lack of enthusiasm investors have been expressing towards stocks at these heights. The setup presents the best chance to see the correction back towards levels of support below, such as major moving averages, and the fact that this buying exhaustion is occurring directly ahead of the period of normal volatility in the market only increases the probability that a pullback will proceed. There is nothing yet to suggest that the rising intermediate trend is at risk, but the technicals and seasonals are aligning to suggest caution in the near-term until a more appropriate risk-reward point to be aggressive in stocks materializes.
Today, in our Market Outlook to subscribers, we discuss the following:
- The action we are taking in the Super Simple Seasonal Portfolio following Thursday’s reversal in equity prices
- The Volatility Index (VIX)
- Percent of stocks trading above 50-day moving averages and the S&P 500 Bullish Percent Index
- Weekly Jobless Claims and the health of the labor market
- Natural gas
Subscribers can look for this report in their inbox or by clicking on the following link and logging in: Market Outlook for July 28
Not signed up yet? Subscribe now to receive full access to all of the research and analysis that we publish.
Sentiment on Thursday, as gauged by the put-call ratio, ended close to neutral at 0.93.
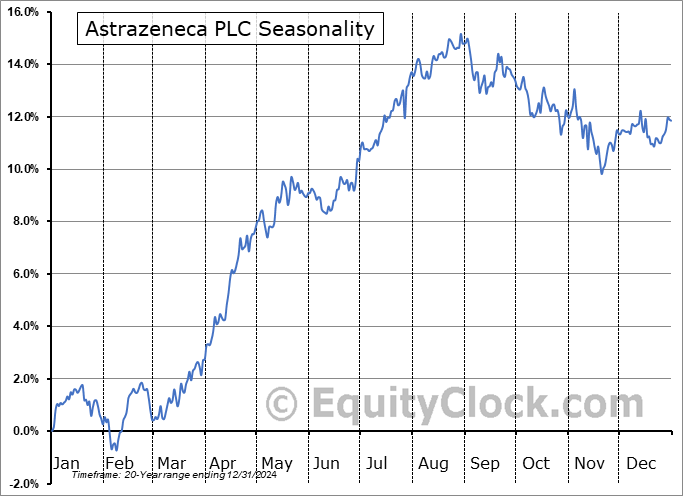
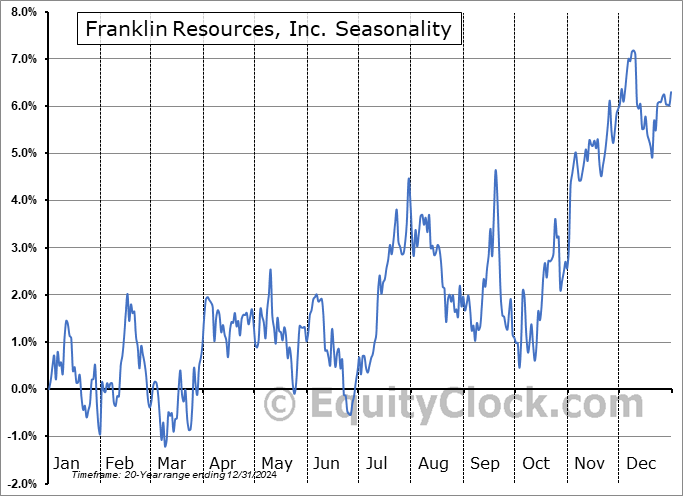
Seasonal charts of companies reporting earnings today:
S&P 500 Index
TSE Composite
| Sponsored By... |

|


