Stock Market Outlook for July 9, 2021

The market has jitters and we’re reacting.
Â
Â
Â
*** Stocks highlighted are for information purposes only and should not be considered as advice to purchase or to sell mentioned securities.  As always, the use of technical and fundamental analysis is encouraged in order to fine tune entry and exit points to average seasonal trends.
Stocks Entering Period of Seasonal Strength Today:
Subscribers – Click on the relevant link to view the full profile. Not a subscriber? Signup here.

Phillips 66 (NYSE:PSX) Seasonal Chart

Innergex Renewable Energy Inc. (TSE:INE.TO) Seasonal Chart

Horizon Bancorp Inc. (NASD:HBNC) Seasonal Chart

Booz Allen Hamilton Holding Corp. (NYSE:BAH) Seasonal Chart
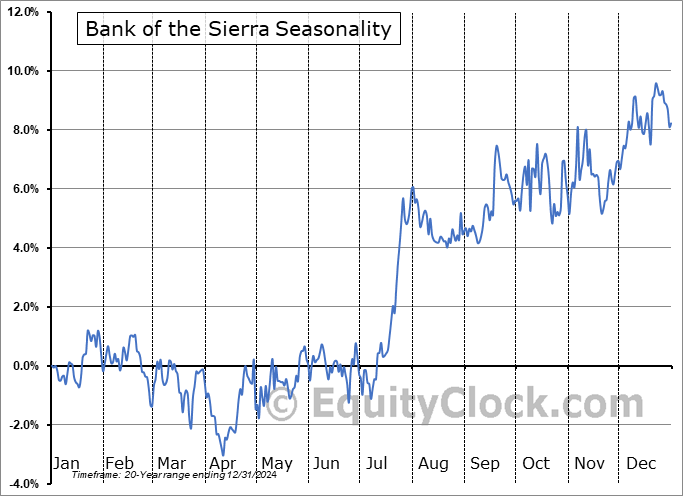
Bank of the Sierra (NASD:BSRR) Seasonal Chart

Pro-Dex, Inc. (NASD:PDEX) Seasonal Chart

Algonquin Power & Utilities Corp. (NYSE:AQN) Seasonal Chart

SPDR S&P Dividend ETF (NYSE:SDY) Seasonal Chart

SPDR S&P Aerospace & Defense ETF (NYSE:XAR) Seasonal Chart
Â
Â
The Markets
Stocks dropped on Thursday amidst emerging concerns about the growth trajectory of the economy as countries around the globe deal with COVID variants. The S&P 500 Index shed nearly nine-tenths of one percent, reaching back to short-term support at the rising 20-day moving average. Buyers steeped in at the short-term hurdle to lift the benchmark off of the lows of the day, but, by the closing bell, a significant blemish in the short-term trend remains. Momentum indicators are rolling over with the Relative Strength Index (RSI) falling out of overbought territory above 70. The benchmark continues to hover around the mid-point to the rising trading range that now hovers approximately between 4250 and 4450.

Today, in our Market Outlook to subscribers, we discuss the following:
- Short-term damage on the chart of the S&P 500 Index and how we’re reacting
- US Petroleum Inventories and our view of the energy sector
- Weekly Jobless Claims and how the trajectory of both initial and continued claims compare to what is normal
- Natural gas in storage and the recent action we’ve taken with regards to the commodity
Subscribe now and we’ll send this outlook to you.
Sentiment on Thursday, as gauged by the put-call ratio, ended bullish at 0.86.

Â
Â
Â
Â
Seasonal charts of companies reporting earnings today:
 Seasonal Chart")

Â
Â
S&P 500 Index


Â
Â
TSE Composite


| Sponsored By... |

|

