Stock Market Outlook for July 15, 2021

Play the period of risk aversion ahead in the equity market with this pair trade.
Â
Â
Â
*** Stocks highlighted are for information purposes only and should not be considered as advice to purchase or to sell mentioned securities.  As always, the use of technical and fundamental analysis is encouraged in order to fine tune entry and exit points to average seasonal trends.
Stocks Entering Period of Seasonal Strength Today:
Subscribers – Click on the relevant link to view the full profile. Not a subscriber? Signup here.
Archer Daniels Midland Co. (NYSE:ADM) Seasonal Chart
Aimia Inc. (TSE:AIM.TO) Seasonal Chart
Alaska Air Group, Inc. (NYSE:ALK) Seasonal Chart
Genworth MI Canada Inc. (TSE:MIC.TO) Seasonal Chart
First Financial Bankshares, Inc. (NASD:FFIN) Seasonal Chart
SPDR Portfolio High Yield Bond ETF (AMEX:SPHY) Seasonal Chart
Enterprise Financial Services Corp. (NASD:EFSC) Seasonal Chart
Idera Pharmaceuticals, Inc. (NASD:IDRA) Seasonal Chart
iShares International High Yield Bond ETF (AMEX:HYXU) Seasonal Chart
iShares Canadian Short Term Bond Index ETF (TSE:XSB.TO) Seasonal Chart
BMO Short Corporate Bond Index ETF (TSE:ZCS.TO) Seasonal Chart
iShares Emerging Markets High Yield Bond ETF (AMEX:EMHY) Seasonal Chart
SPDR Barclays International Corporate Bond ETF (NYSE:IBND) Seasonal Chart
VanEck Vectors International High Yield Bond ETF (AMEX:IHY) Seasonal Chart
iShares Global 100 ETF (NYSE:IOO) Seasonal Chart
PIMCO Enhanced Short Maturity Active ETF (NYSE:MINT) Seasonal Chart
Â
Â
The Markets
Stocks closed mixed on Wednesday as core cyclical bets, primarily energy and financials, dragged on broad market benchmarks, again. The S&P 500 Index closed with a gain of just over a tenth of one percent as short-term resistance around 4400 continues to become apparent. The benchmark remains above short-term support at its rising 20-day moving average, as well as horizontal support at 4250. Momentum indicators on the daily chart are struggling to gain upside traction as the MACD histogram continues to contract. While the benchmark remains well below the upper limit to its intermediate trading range between 4250 and 4450, it seems as though investors require an upside catalyst to push it forward. That catalyst could come from earnings, but, barring any fundamental shift, this market seems to be in need of a breather. Breadth in this market remains lousy with around half of the benchmark’s constituents trading below their 50-day moving averages and hints of risk aversion are leaching in to market performance. This is all very logical for the time of year that we are heading into, requiring more of a cautious stance in portfolio positioning over the near-term.
Today, in our Market Outlook to subscribers, we discuss the following:
- The shift towards risk aversion as indicated by this ratio and how to trade it
- US petroleum inventories and our view of the energy sector
- Canada Manufacturing Sales and what is driving activity
Subscribe now and we’ll send this outlook to you.
Sentiment on Wednesday, as gauged by the put-call ratio, ended bullish at 0.81.
Â
Â
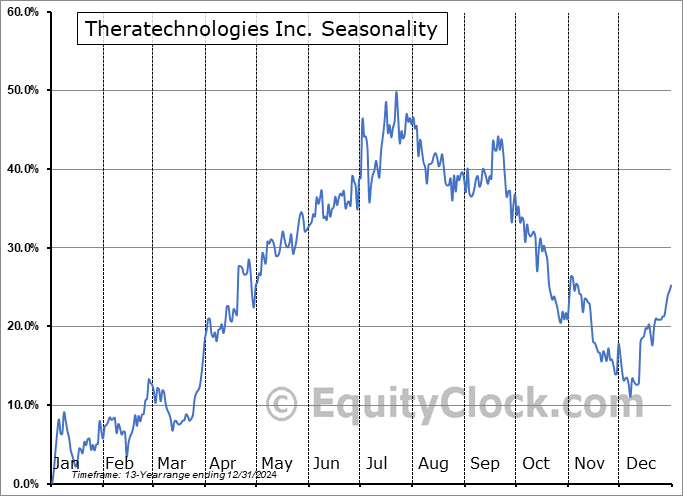
Seasonal charts of companies reporting earnings today:
Â
Â
S&P 500 Index
Â
Â
TSE Composite
| Sponsored By... |

|


