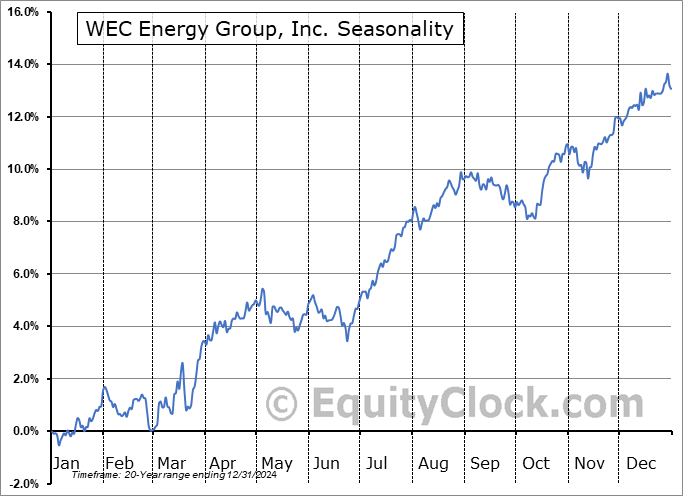
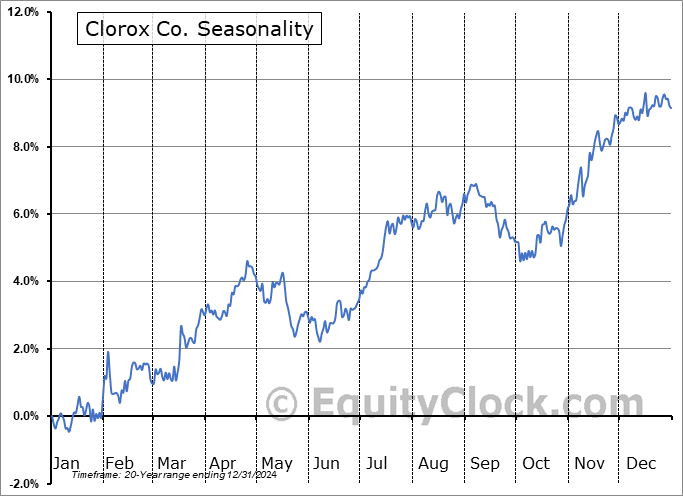
Stock Market Outlook for August 3, 2021

The S&P 500 Index has averaged a loss of 0.1% in August over the past two decades, however, 60% of the periods have ended with gains.
Â
Â
*** Stocks highlighted are for information purposes only and should not be considered as advice to purchase or to sell mentioned securities.  As always, the use of technical and fundamental analysis is encouraged in order to fine tune entry and exit points to average seasonal trends.
Stocks Entering Period of Seasonal Strength Today:
Subscribers – Click on the relevant link to view the full profile. Not a subscriber? Signup here.
Sysco Corp. (NYSE:SYY) Seasonal Chart
Polo Ralph Lauren Corp. (NYSE:RL) Seasonal Chart
Stamps.com, Inc. (NASD:STMP) Seasonal Chart
First Trust ISE Global Engineering and Construction Index Fund (NYSE:FLM) Seasonal Chart
BMO Canadian Dividend ETF (TSE:ZDV.TO) Seasonal Chart
iShares North American Tech-Software ETF (NYSE:IGV) Seasonal Chart
Visa Inc. (NYSE:V) Seasonal Chart
Mettler Toledo Intl, Inc. (NYSE:MTD) Seasonal Chart
Everest Re Group, Ltd. (NYSE:RE) Seasonal Chart
Cineplex Inc. (TSE:CGX.TO) Seasonal Chart
Weibo Corp. (NASD:WB) Seasonal Chart
Fiat Chrysler Automobiles NV (NYSE:FCAU) Seasonal Chart
Las Vegas Sands Corp. (NYSE:LVS) Seasonal Chart
EOG Resources, Inc. (NYSE:EOG) Seasonal Chart
Urban Outfitters, Inc. (NASD:URBN) Seasonal Chart
Haverty Furniture Cos., Inc. (NYSE:HVT) Seasonal Chart
John Bean Technologies Corp. (NYSE:JBT) Seasonal Chart
Global X China Consumer ETF (NYSE:CHIQ) Seasonal Chart
Â
Note: As a result of Civic Holiday in Canada on Monday, our next report will be released on Tuesday.
Â
The Markets
Stocks drifted lower in the last session of July as portfolio managers conducted their final trades prior to the beginning of August. The S&P 500 Index shed just over half of one percent, weighed down by consumer discretionary following Amazon’s earnings miss. The benchmark is reaching back to levels around short-term support at its 20-day moving average. The rising 50-day moving average remains the intermediate bogey, supporting the trend of higher-highs and higher-lows since last fall. Momentum indicators are showing signs of rolling over again, which is not necessarily immediately concerning in itself, but the fact that they are rolling over below the previous peaks charted earlier in July does give cause for concern. MACD and RSI are negatively diverging from price, suggesting waning buying demand. As we get into the month of August we will obtain a better view of whether some of these gyrations in the market in recent days mean anything or whether they are just part of a month-end/start of the month fluctuation. The market is in a bit of a vulnerable position and, while we desire to maintain a positive bias longer-term, a pullback is certainly due.
For the month, the large-cap benchmark was higher by 2.27%, marking the sixth straight month of gains. The strength is firmly better than the 1.2% gain that has been average for July over the past two decades. Momentum indicators from this monthly view remain overbought, but, while slight signs of stalling can be observed (eg. the flattening of the MACD histogram), they have yet to show indications of rolling over. From this look, price has punched a hole in the upper limit to the long-term rising trading range, brining this market full circle from the brief breakdown below the range that was recorded at the lows of the pandemic in March of 2020. Looking exclusively at the large-cap benchmark, price appears to be stretched, but, aside from some brief upticks in volatility over the past month, this has yet to deter investors from finding things to buy.
For the month ahead, a flat result is the norm with the large-cap benchmark losing an average of 0.1% in this summer period. Gains have been realized in 60% on Augusts over the past 20 years. Returns have ranged from a loss of 6.4% in August of 2001 to a gain of 7.0% in August of last year (2020). The months ahead are known for rising volatility, which can cause erratic and unexpected results. We break it all down in our monthly report that was released to subscribers on Thursday. Signup now to receive a copy.

Just released…
Our monthly report for August is out, providing everything that you need to know for the month(s) ahead.
Highlights in this report include:
- Equity market tendencies in the month of August
- Favor bonds or stocks?
- REITs
- From a positive trend for stocks to one that is range-bound
- Normal instability for this point in the market cycle
- The abnormal uptick in respiratory illnesses for this time of year
- From 14-year lows to multi-month highs, credit conditions are changing course
- The shift towards risk aversion
- Time to be constructive in the builders?
- Continued strains resulting from supply chain disruptions
- The inventory issue
- Industrial production has normalized, but manufacturer sentiment remains strong
- Deterioration of breadth
- The negative reactions to declining 50-day moving averages
- Break of trend for the TSX
- The technical status of the S&P 500 Index
- Positioning for the months ahead
- Sector reviews and ratings
- Stocks that have frequently gained in the month of August
- Notable stocks and ETFs entering their period of strength in August
Look for this report in your inbox.
Not subscribed yet? Signup now and we’ll send this report to you.
With the new month now upon us and as we celebrate the release of our monthly report for August, today we release our screen of all of the stocks that have gained in every August over their trading history. While we at Equity Clock focus on a three-pronged approach (seasonal, technical, and fundamental analysis) to gain exposure to areas of the market that typically perform well over intermediate (2 to 6 months) timeframes, we know that stocks that have a 100% frequency of success for a particular month is generally of interest to those pursuing a seasonal investment strategy. Below are the results:
And how about those securities that have never gained in this eighth month of the year, here they are:
*Note: None of the results highlighted above have the 20 years of data that we like to see in order to accurately gauge the annual recurring, seasonal influences impacting an investment, therefore the reliability of the results should be questioned. We present the above list as an example of how our downloadable spreadsheet can be filtered.
In January, we announced that we had added the monthly average returns and monthly frequency of gains for each investment to our downloadable spreadsheet that is available to yearly subscribers (if you are a monthly subscriber and have been with us for over a year, feel free to reach out to us to request a copy). The inclusion of this data allows for more detailed data mining all from the convenience of a filterable spreadsheet. The possibilities are endless. Filter the results down to all the stocks in the market with at least 20 years of data that have gained in at least 80% of Augusts, find all of the stocks that show an optimal holding period that begins in September with strong average returns in October and November, or drill down to all of the stocks that correlate strongly with the period of seasonal strength for the sector in which it is categorized. We continue to look for opportunities to include the results of some filters that our audience may find of interest in our regular reports. Annual subscribers can login and download this spreadsheet in the “Download†section of the chart database at https://charts.equityclock.com/.

Today, in our Market Outlook to subscribers, we discuss the following:
- Canada Gross Domestic Product (GDP) and what is driving activity
Subscribe now and we’ll send this outlook to you.
Sentiment on Friday, as gauged by the put-call ratio, ended bullish at 0.83.
Â
Seasonal charts of companies reporting earnings today:
Â
Â
S&P 500 Index
Â
TSE Composite
| Sponsored By... |

|


