Stock Market Outlook for August 24, 2021

The market has found a footing at the rising 50-day moving average and it’s not just the capitalization weighted S&P 500 Index holding this variable level as support.
Â
Â
Â
*** Stocks highlighted are for information purposes only and should not be considered as advice to purchase or to sell mentioned securities.  As always, the use of technical and fundamental analysis is encouraged in order to fine tune entry and exit points to average seasonal trends.
Stocks Entering Period of Seasonal Strength Today:
Subscribers – Click on the relevant link to view the full profile. Not a subscriber? Signup here.
Intel Corp. (NASD:INTC) Seasonal Chart
VeriSign, Inc. (NASD:VRSN) Seasonal Chart
L Brands, Inc. (NYSE:LB) Seasonal Chart
Gran Tierra Energy Inc. (TSE:GTE.TO) Seasonal Chart
Canadian Life Companies Split Corp. (TSE:LFE.TO) Seasonal Chart
Pinnacle Financial Partners, Inc. (NASD:PNFP) Seasonal Chart
Express Inc. (NYSE:EXPR) Seasonal Chart
Primoris Services Corp. (NASD:PRIM) Seasonal Chart
SeaChange Intl, Inc. (NASD:SEAC) Seasonal Chart
Taoping, Inc. (NASD:TAOP) Seasonal Chart
Vanguard FTSE Developed All Cap ex U.S. Index ETF (CAD-hedged) (TSE:VEF.TO) Seasonal Chart
China Fund, Inc. (NYSE:CHN) Seasonal Chart
WisdomTree Japan Hedged Equity Fund (NYSE:DXJ) Seasonal Chart
iShares Currency Hedged MSCI EAFE ETF (AMEX:HEFA) Seasonal Chart
iShares Currency Hedged MSCI Japan ETF (AMEX:HEWJ) Seasonal Chart
Â
Â
The Markets
Stocks jumped on Monday as major benchmarks rebound from levels of intermediate support that were tested last week. The S&P 500 Index gained over eight-tenths of one percent, closing less than a point away from the all-time high that was charted on August 16th at 4479.71. It was just on Thursday that the benchmark had pulled back to rising intermediate support and the lower limit of the rising trading range around the 50-day moving average and, almost in an instant, we are back to all-time high levels. The resiliency of the bulls has been impressive, keeping the rising intermediate-term trend of higher-highs and higher-lows intact. The benchmark is now back to the mid-point to its approximately 200-point range that now spans between 4375 and 4575, the upper half of which has proved to be troublesome to the bullish camp over the past few months. Momentum indicators continue to hold within the upper half of their ranges, characteristic of a bullish trend, even as the enthusiasm towards stocks has seemingly faded since the spring.
Today, in our Market Outlook to subscribers, we discuss the following:
- Benchmark regaining intermediate support at rising 50-day moving averages
- Notable upgrades and downgrades in this week’s chart books:Â Find out what joins our list of areas of the market to Accumulate
- US Existing Home Sales and the SPDR Homebuilders ETF
Subscribe now and we’ll send this outlook to you.
Want to know which areas of the market to buy or sell? Our Weekly Chart Books have just been updated, providing a clear Accumulate, Avoid, or Neutral rating for currencies, cryptocurrencies, commodities, broad markets, and subsectors/industries of the market. Subscribers can login and click on the relevant links to access.
Subscribe now.
Sentiment on Monday, as gauged by the put-call ratio, ended bullish at 0.78.
Â
Â
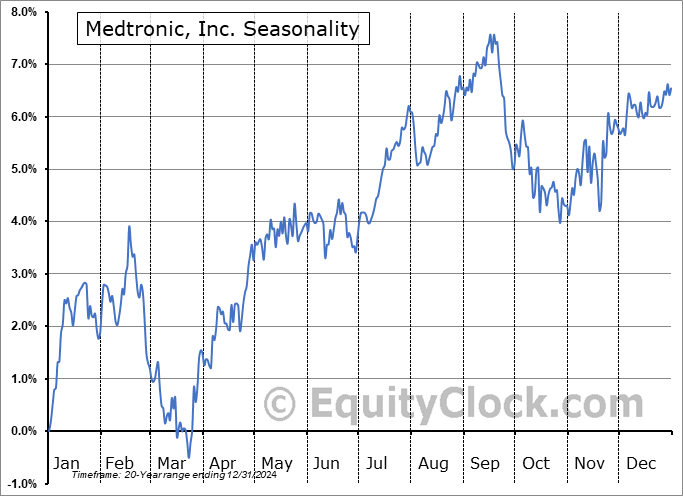
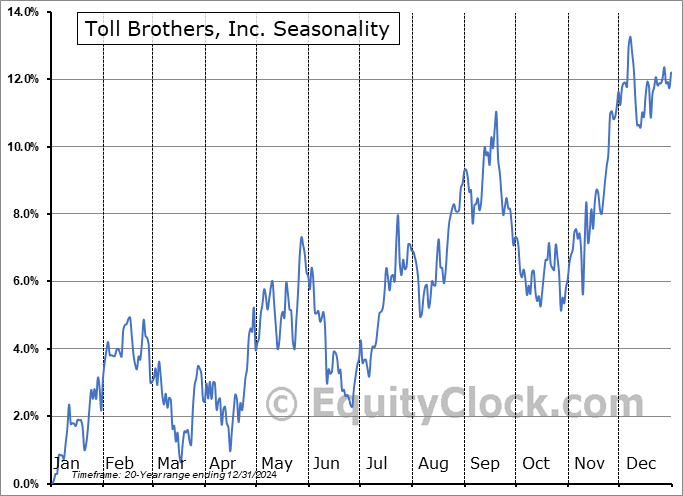
Seasonal charts of companies reporting earnings today:
Â
Â
S&P 500 Index
Â
Â
TSE Composite
| Sponsored By... |

|


