Stock Market Outlook for August 27, 2021

As we look to the Fed symposium on Friday, this interest rate sensitive sector may be ripe for profit-taking as its period of seasonal strength comes to an end.
Â
Â
Â
*** Stocks highlighted are for information purposes only and should not be considered as advice to purchase or to sell mentioned securities.  As always, the use of technical and fundamental analysis is encouraged in order to fine tune entry and exit points to average seasonal trends.
Stocks Entering Period of Seasonal Strength Today:
Subscribers – Click on the relevant link to view the full profile. Not a subscriber? Signup here.

Delta Air Lines Inc. (NYSE:DAL) Seasonal Chart

International Bancshares Corp. (NASD:IBOC) Seasonal Chart

Grupo Financiero Galicia S.A. ADS (NASD:GGAL) Seasonal Chart

Curis, Inc. (NASD:CRIS) Seasonal Chart

Corby Spirit and Wine Ltd. (TSE:CSW/A.TO) Seasonal Chart

Invesco Russell Top 200 Equal Weight ETF (AMEX:EQWL) Seasonal Chart

Invesco S&P SmallCap 600 Equal Weight ETF (AMEX:EWSC) Seasonal Chart

Greif Bros. Corp. (NYSE:GEF/B) Seasonal Chart

22nd Century Group, Inc. (AMEX:XXII) Seasonal Chart
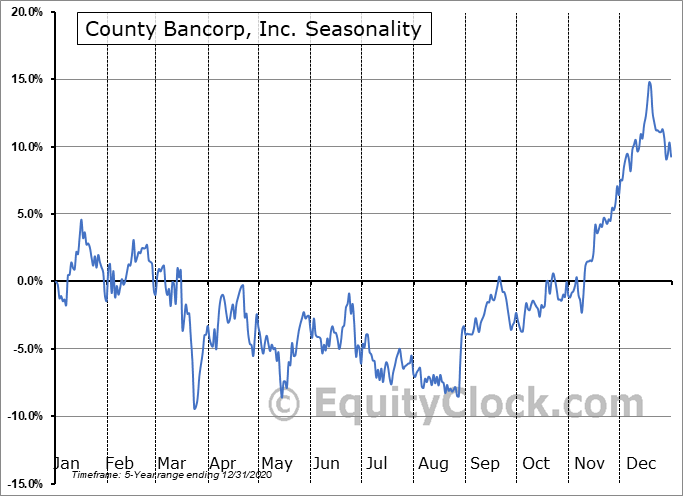
County Bancorp, Inc. (NASD:ICBK) Seasonal Chart

Rayonier Advanced Materials Inc. (NYSE:RYAM) Seasonal Chart

WisdomTree U.S. Quality Dividend Growth Fund (NASD:DGRW) Seasonal Chart

iShares Transportation Average ETF (NYSE:IYT) Seasonal Chart

ValueShares US Quantitative Value ETF (AMEX:QVAL) Seasonal Chart

Vanguard S&P Small-Cap 600 Value ETF (NYSE:VIOV) Seasonal Chart

Charles Schwab Corp. (NYSE:SCHW) Seasonal Chart

Albemarle Corp. (NYSE:ALB) Seasonal Chart

Thor Industries, Inc. (NYSE:THO) Seasonal Chart
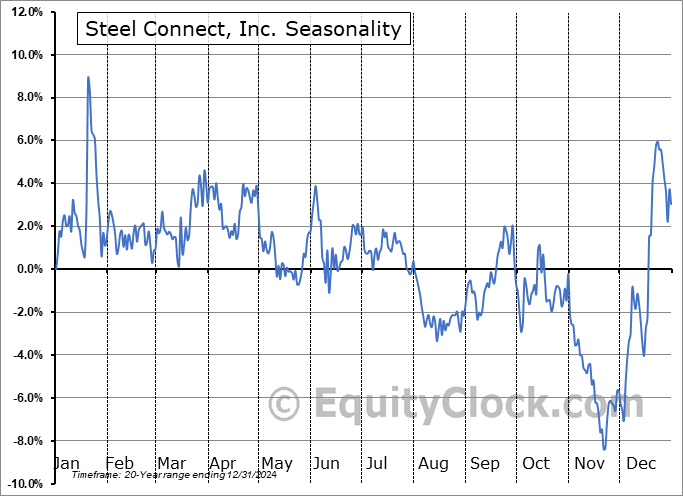
Steel Connect, Inc. (NASD:STCN) Seasonal Chart

Matson, Inc. (NYSE:MATX) Seasonal Chart

Invesco S&P SmallCap Financials ETF (NASD:PSCF) Seasonal Chart
Â
Â
The Markets
Stocks slipped on Thursday as investors reacted to the tragic news out of Afghanistan and prepare for the Fed symposium on Friday. The S&P 500 Index ended down by close to six-tenths of one percent, cutting the week-to-date gain in half. Once again, the market is turning lower from around the mid-point to its rising 200-point range that is now getting closer to 4400 and 4600. The lack of enthusiasm amongst investors at these market heights continues to be implied. MACD is still showing signs of negatively diverging from price, also an ongoing testament to the waning buying demand that has been apparent for the past month and a half. Short-term support can still be pegged at the rising 20-day moving average at 4441, while intermediate support at the rising 50-day moving average is the level that every trader/investor has had their eye on for months given the dip-buying opportunities that it has allowed.

Today, in our Market Outlook to subscribers, we discuss the following:
- Retail stocks rolling over from resistance and when our window of opportunity will open to take position in the industry
- REITs and the conclusion of the period of seasonal strength for the sector
- Weekly Jobless Claims and the health of the labor market
- Returning to our ongoing look at the trend of COVID cases in the US
- Natural gas inventories and the seasonal trade for the commodity
Subscribe now and we’ll send this outlook to you.
Sentiment on Thursday, as gauged by the put-call ratio, ended bullish at 0.86.

Â
Â
Seasonal charts of companies reporting earnings today:


Â
Â
S&P 500 Index


Â
Â
TSE Composite


| Sponsored By... |

|

