Stock Market Outlook for October 4, 2021

Investors showing signs of taking on risk.
Â
Â
Â
*** Stocks highlighted are for information purposes only and should not be considered as advice to purchase or to sell mentioned securities.  As always, the use of technical and fundamental analysis is encouraged in order to fine tune entry and exit points to average seasonal trends.
Stocks Entering Period of Seasonal Strength Today:
Subscribers – Click on the relevant link to view the full profile. Not a subscriber? Signup here.
United Rentals, Inc. (NYSE:URI) Seasonal Chart
Omnicom Group, Inc. (NYSE:OMC) Seasonal Chart
ANSYS, Inc. (NASD:ANSS) Seasonal Chart
EMCOR Group, Inc. (NYSE:EME) Seasonal Chart
Gentex Corp. (NASD:GNTX) Seasonal Chart
Aegion Corp. (NASD:AEGN) Seasonal Chart
Ceva Inc. (NASD:CEVA) Seasonal Chart
Progress Software Corp. (NASD:PRGS) Seasonal Chart
Triton International Ltd. (NYSE:TRTN) Seasonal Chart
American Superconductor Corp. (NASD:AMSC) Seasonal Chart
Silicom Ltd. (NASD:SILC) Seasonal Chart
Oppenheimer Holdings Inc. (NYSE:OPY) Seasonal Chart
Cameco Corp. (NYSE:CCJ) Seasonal Chart
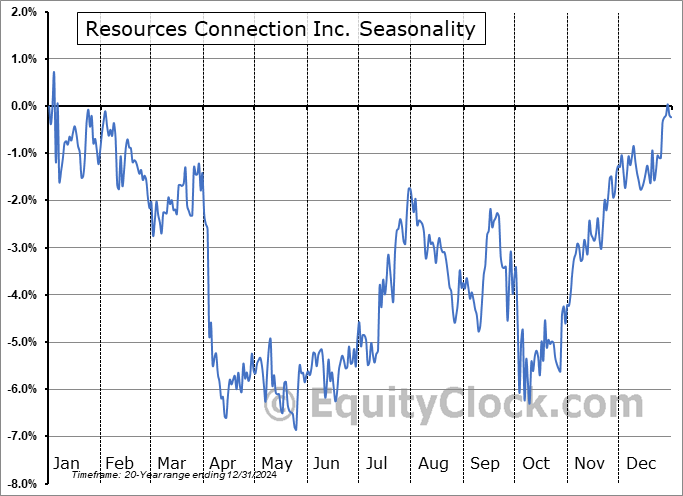
Resources Connection Inc. (NASD:RGP) Seasonal Chart
iShares Global Agriculture Index ETF (TSE:COW.TO) Seasonal Chart
iShares MSCI Germany ETF (NYSE:EWG) Seasonal Chart
iShares U.S. Regional Banks ETF (NYSE:IAT) Seasonal Chart
Invesco S&P SmallCap Value with Momentum ETF (AMEX:XSVM) Seasonal Chart
Freeport-McMoRan, Inc. (NYSE:FCX) Seasonal Chart
Pan American Silver Corp. (TSE:PAAS.TO) Seasonal Chart
Uranium Participation Corp. (TSE:U.TO) Seasonal Chart
Commercial Metals Co. (NYSE:CMC) Seasonal Chart
Knight-Swift Transportation Holdings Inc. (NYSE:KNX) Seasonal Chart
Trinity Industries Inc. (NYSE:TRN) Seasonal Chart
Nutrien Ltd. (TSE:NTR.TO) Seasonal Chart
VanEck Vectors ETF Total Return (NYSE:HAP) Seasonal Chart
Â
Â
The Markets
Stocks rebounded on Friday, kicking off the first session of the fourth quarter on a positive note. The S&P 500 Index surged by 1.15%, retaking levels back above the 100-day moving average that was broken on Thursday. Momentum indicators are attempting to rebound as investors gravitate back towards risk. Previous rising trend channel support remains in a position of resistance near 4500. The same can be said of the 20-day moving average, which capped the rebound attempt into the end of September.
Today, in our Market Outlook to subscribers, we discuss the following:
- Weekly look at the large-cap benchmark
- Risky areas of the market catching a bid
- US Construction Spending, what is driving activity, and how to play it
Subscribe now and we’ll send this outlook to you.
Just released…
Our 118-page monthly report has just been distributed to subscribers, providing insight on everything you need to know from seasonal, technical, and fundamental perspectives through the month(s) ahead.
Highlights in this report include:
- Equity market tendencies in the month of October
- High yield spreads have stopped going down
- Bond Prices and the conclusion to the period of seasonal strength
- Economic beats becoming fewer
- Evidence that the fourth wave of COVID took a toll on activity at the end of summer
- Waning strength of the consumer ahead of the holiday season
- Semiconductors
- Weak Existing Home Sales
- Tracking the spread of COVID
- The rebirth of reopening plays in the market
- Bullish sentiment being washed out
- Shipping demand remaining strong into the prime end of year spending season
- The strength of the manufacturing economy
- Manufacturers upbeat about their prospects through the months ahead
- US Dollar
- Period of seasonal strength for Natural Gas
- The desired exposure to the energy sector
- Market Breadth and the sustainability of the strength in the market
- The technical status of the S&P 500 Index
- Positioning for the months ahead
- Sector reviews and ratings
- Stocks that have frequently gained in the month of October
- Notable stocks and ETFs entering their period of strength in October
Subscribe now and we’ll send this and other insights directly to you inbox on a regular basis.
Sentiment on Friday, as gauged by the put-call ratio, ended bullish at 0.94.
Â
Â
Seasonal charts of companies reporting earnings today:
Â
Â
S&P 500 Index
Â
Â
TSE Composite
| Sponsored By... |

|


