Stock Market Outlook for November 15, 2021

The breakout of the $8 trading range on the Industrial Sector ETF projects an upside target of $114.
Â
Â
Â
*** Stocks highlighted are for information purposes only and should not be considered as advice to purchase or to sell mentioned securities.  As always, the use of technical and fundamental analysis is encouraged in order to fine tune entry and exit points to average seasonal trends.
Stocks Entering Period of Seasonal Strength Today:
Subscribers – Click on the relevant link to view the full profile. Not a subscriber? Signup here.
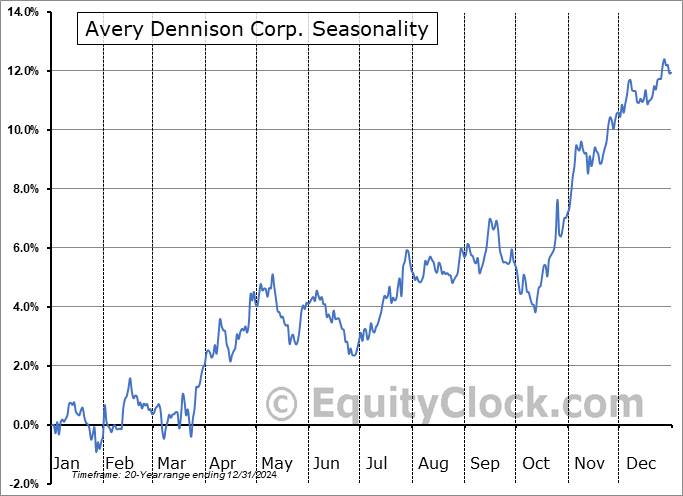
Avery Dennison Corp. (NYSE:AVY) Seasonal Chart
Tidewater, Inc. (NYSE:TDW) Seasonal Chart
Northland Power Inc. (TSE:NPI.TO) Seasonal Chart
Becton Dickinson and Co. (NYSE:BDX) Seasonal Chart
Chartwell Retirement Residences (TSE:CSH/UN.TO) Seasonal Chart
Esco Technologies, Inc. (NYSE:ESE) Seasonal Chart
Embraer Aircraft (NYSE:ERJ) Seasonal Chart
Avery Dennison Corp. (NYSE:AVY) Seasonal Chart
Barrick Gold Corp. (TSE:ABX.TO) Seasonal Chart
Superior Plus Corp. (TSE:SPB.TO) Seasonal Chart
Skechers Usa, Inc. (NYSE:SKX) Seasonal Chart
Pilgrims Pride Corp. (NASD:PPC) Seasonal Chart
NorthWestern Corp. (NASD:NWE) Seasonal Chart
Annaly Capital Management, Inc. (NYSE:NLY) Seasonal Chart
CAE, Inc. (NYSE:CAE) Seasonal Chart
iShares MSCI Italy Capped ETF (NYSE:EWI) Seasonal Chart
iShares Mortgage Real Estate Capped ETF (NYSE:REM) Seasonal Chart
Invesco Global Listed Private Equity ETF (NYSE:PSP) Seasonal Chart
Â
Â
Â
The Markets
Stocks continued to rebound from early week losses on Friday as the ebb and flow amongst sectors continues. The S&P 500 Index gained almost three-quarters of one percent as investors snapped up names in the materials, industrials and technology sectors. Momentum indicators have rolled over in recent days, alleviating the overbought extremes that had become apparent following the significant gains recorded between the end of September and the start of November. Momentum indicators continue to hold above their middle lines, which is characteristic of a bullish trend. Short and intermediate downside risks remain to the rising 20 and 50-day moving averages, now at 4608 and 4492, respectively, however, the general trend of the market is that of higher-highs and higher-lows. Rising trendline resistance can be seen at 4750.
Today, in our Market Outlook to subscribers, we discuss the following:
- Weekly look at the large-cap benchmark and our speculation of when a blow-off top in the market may peak
- Job Openings and Labor Turnover Survey (JOLTS) and what is driving the opportunities in the economy
- The Industrial Sector ETF
- Palladium
Subscribe now and we’ll send this outlook to you.
Sentiment on Friday, as gauged by the put-call ratio, ended bullish at 0.76.
Â
Â
Seasonal charts of companies reporting earnings today:
Â
Â
S&P 500 Index
Â
Â
TSE Composite
| Sponsored By... |

|


