Stock Market Outlook for December 14, 2021

Bitcoin is moving below trendline support as it enters its seasonally weakest time of the year that spans the next three months.
Â
Â
Â
*** Stocks highlighted are for information purposes only and should not be considered as advice to purchase or to sell mentioned securities.  As always, the use of technical and fundamental analysis is encouraged in order to fine tune entry and exit points to average seasonal trends.
Stocks Entering Period of Seasonal Strength Today:
Subscribers – Click on the relevant link to view the full profile. Not a subscriber? Signup here.

iShares S&P/TSX 60 Index ETF (TSE:XIU.TO) Seasonal Chart

Schlumberger Ltd. (NYSE:SLB) Seasonal Chart

Unum Group (NYSE:UNM) Seasonal Chart

SPX Corp. (NYSE:SPXC) Seasonal Chart

Cooper Cos. Inc. (NYSE:COO) Seasonal Chart

CRH Medical Corp. (TSE:CRH.TO) Seasonal Chart

Touchstone Exploration, Inc. (TSE:TXP.TO) Seasonal Chart

First Asset Morningstar Canada Momentum Index ETF (TSE:WXM.TO) Seasonal Chart

First Trust NYSE Arca Biotechnology Index Fund (NYSE:FBT) Seasonal Chart

SPDR S&P Global Natural Resources ETF (NYSE:GNR) Seasonal Chart

iShares Russell Mid-Cap ETF (NYSE:IWR) Seasonal Chart

iShares Morningstar Mid-Cap ETF (NYSE:JKG) Seasonal Chart

SPDR S&P 400 Mid Cap Value ETF (NYSE:MDYV) Seasonal Chart

Invesco DWA Basic Materials Momentum ETF (NASD:PYZ) Seasonal Chart

Schwab US Small-Cap ETF (NYSE:SCHA) Seasonal Chart
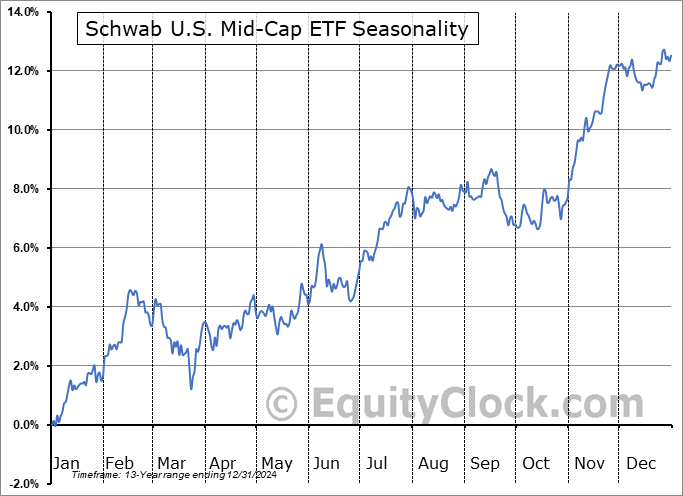
Schwab U.S. Mid-Cap ETF (NYSE:SCHM) Seasonal Chart
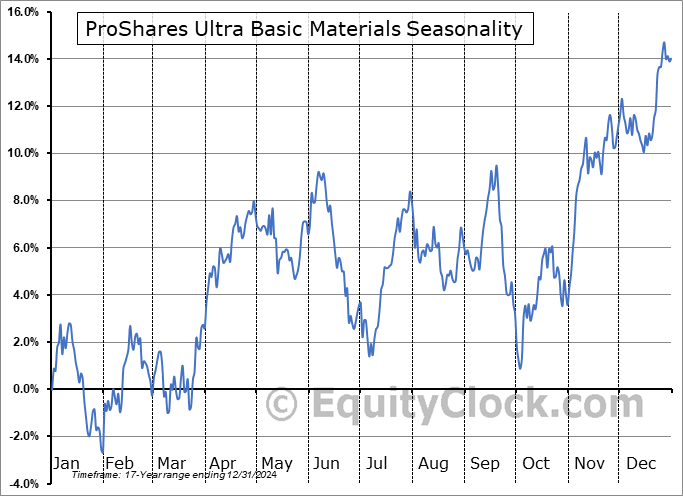
ProShares Ultra Basic Materials (NYSE:UYM) Seasonal Chart

Vanguard Mid-Cap ETF (NYSE:VO) Seasonal Chart

Invesco S&P SmallCap Momentum ETF (AMEX:XSMO) Seasonal Chart
Â
Â
The Markets
Stocks slipped to start the week as ongoing concerns pertaining to the COVID variant had investors trimming risk. The S&P 500 Index shed nine-tenths of one percent, pulling back following a test of former resistance around 4700 on Friday. Short-term support can be pegged at the 20-day moving average, now at 4651, while last week’s open gap between 4615 and 4635 provides a level to shoot off of in order to stay long the market. A break below this short-term range opens significant risks that a double top around 4700 has developed, warranting a retrenchment of bullish bets. We will cross that bridge when we come to it. the 50- and 200-day moving averages continue to point higher, suggesting a positive bias remains warranted over intermediate to long-term timeframes.

Want to know which areas of the market to buy or sell? Our Weekly Chart Books have just been updated, providing a clear Accumulate, Avoid, or Neutral rating for currencies, cryptocurrencies, commodities, broad markets, and subsectors/industries of the market. Subscribers can login and click on the relevant links to access.
Subscribe now.
Today, in our Market Outlook to subscribers, we discuss the following:
- Notable ratings changes in our weekly chart books: Find out what has been upgraded to Accumulate this week
- The downfall in the consumer discretionary sector
- The break of trendline support for Bitcoin going into its period of seasonal weakness
- Other signals of risk aversion in the market
- The average low for stocks during the tax-loss selling period in December
- Booking profits in the home builders
- Investor sentiment
Subscribe now and we’ll send this outlook to you.
Sentiment on Monday, as gauged by the put-call ratio, ended close to neutral at 0.99. Â

Â
Â
Seasonal charts of companies reporting earnings today:


Â
Â
S&P 500 Index


Â
Â
TSE Composite


| Sponsored By... |

|

