Stock Market Outlook for December 15, 2021

Technical concerns have escalated with the rejection of the large-cap benchmark from resistance around the previous peak, forcing us to act.
Â
Â
Â
*** Stocks highlighted are for information purposes only and should not be considered as advice to purchase or to sell mentioned securities.  As always, the use of technical and fundamental analysis is encouraged in order to fine tune entry and exit points to average seasonal trends.
Stocks Entering Period of Seasonal Strength Today:
Subscribers – Click on the relevant link to view the full profile. Not a subscriber? Signup here.
Suncor Energy, Inc. (TSE:SU.TO) Seasonal Chart
TORC Oil & Gas Ltd. (TSE:TOG.TO) Seasonal Chart
Kinder Morgan Inc. (NYSE:KMI) Seasonal Chart
Roxgold, Inc. (TSE:ROXG.TO) Seasonal Chart
Timken Co. (NYSE:TKR) Seasonal Chart
Iconix Brand Group, Inc. (NASD:ICON) Seasonal Chart
ProShares Ultra MSCI Emerging Markets (NYSE:EET) Seasonal Chart
Abraxas Petroleum Corp. (NASD:AXAS) Seasonal Chart
Invesco S&P MidCap 400 Equal Weight ETF (AMEX:EWMC) Seasonal Chart
BHP Billiton plc (NYSE:BBL) Seasonal Chart
BMO S&P/TSX Equal Weight Global Base Metals Hedged to CAD Index ETF (TSE:ZMT.TO) Seasonal Chart
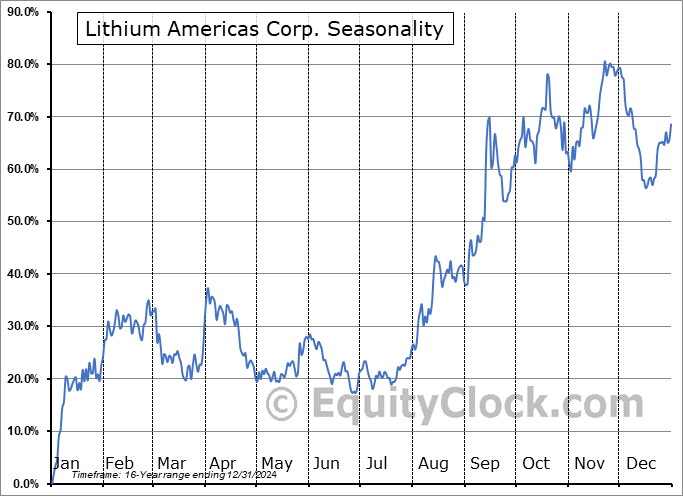
Lithium Americas Corp. (NYSE:LAC) Seasonal Chart
Wyndham Destinations, Inc. (NYSE:WYND) Seasonal Chart
Jacobs Engineering Group Inc. (NYSE:J) Seasonal Chart
iShares S&P/TSX Small Cap Index ETF (TSE:XCS.TO) Seasonal Chart
iShares Core Aggressive Allocation ETF (NYSE:AOA) Seasonal Chart
Invesco MSCI Global Timber ETF (NYSE:CUT) Seasonal Chart
iShares MSCI South Africa ETF (NYSE:EZA) Seasonal Chart
VanEck Vectors Gold Miners ETF (NYSE:GDX) Seasonal Chart
iShares Global Materials ETF (NYSE:MXI) Seasonal Chart
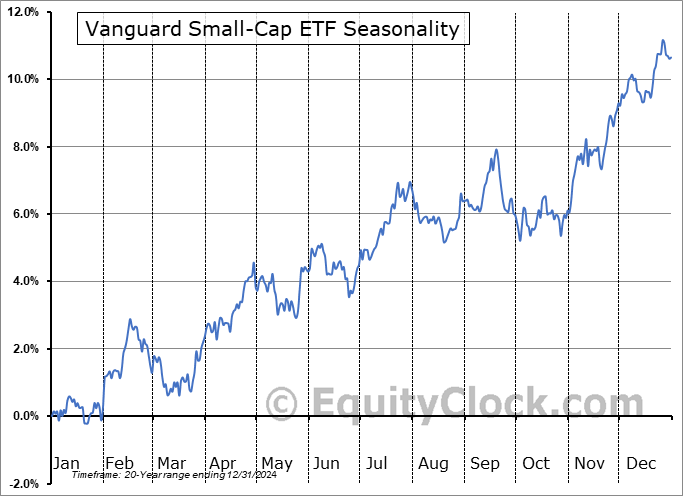
Vanguard Small-Cap ETF (NYSE:VB) Seasonal Chart
Invesco S&P International Developed Momentum ETF (AMEX:IDMO) Seasonal Chart
Â
Â
The Markets
Stocks sold off for a second day as end of year portfolio rebalancing, along with Omicron concerns, had investors reallocating risk. The S&P 500 Index shed 0.75%, gapping below short-term support at the 20-day moving average. Resistance around 4715 has become defined. The benchmark has closed the upside open gap that was charted a week ago Tuesday and the intermediate-term trend is now under threat. Given that this timeframe plays directly to our seasonal trades, we are paying attention. Intermediate support can be pegged at the rising 50-day moving average at 4586. Momentum indicators have curled lower with MACD even flirting with a sell signal as it encroaches on its signal line.
Today, in our Market Outlook to subscribers, we discuss the following:
- Concerns pertaining to the market technicals and how we are reacting
- Tracking the ongoing spread of COVID in the US versus seasonal norms for respiratory illnesses
- Investor sentiment
- High yield spreads
Subscribe now and we’ll send this outlook to you.
Sentiment on Tuesday, as gauged by the put-call ratio, ended close to neutral at 0.95.
Â
Â
Seasonal charts of companies reporting earnings today:
Â
Â
S&P 500 Index
Â
Â
TSE Composite
| Sponsored By... |

|


