Stock Market Outlook for January 31, 2022

The extreme bearish sentiment in the market suggests that the risk of holding stocks here is low.
*** Stocks highlighted are for information purposes only and should not be considered as advice to purchase or to sell mentioned securities. As always, the use of technical and fundamental analysis is encouraged in order to fine tune entry and exit points to average seasonal trends.
Stocks Entering Period of Seasonal Strength Today:
Subscribers – Click on the relevant link to view the full profile. Not a subscriber? Signup here.

Autohome Inc. (NYSE:ATHM) Seasonal Chart

ProShares Ultra Russell2000 (NYSE:UWM) Seasonal Chart

Citrix Systems, Inc. (NASD:CTXS) Seasonal Chart

VMware Inc. (NYSE:VMW) Seasonal Chart

TETRA Technologies (NYSE:TTI) Seasonal Chart

Allstate Corp. (NYSE:ALL) Seasonal Chart

Tyson Foods Inc Cl A (NYSE:TSN) Seasonal Chart

Broadridge Financial Solutions, LLC (NYSE:BR) Seasonal Chart

Nordson Corp. (NASD:NDSN) Seasonal Chart

Polaris Inds, Inc. (NYSE:PII) Seasonal Chart

Teledyne Technologies (NYSE:TDY) Seasonal Chart

DHI Group, Inc. (NYSE:DHX) Seasonal Chart

ProShares Ultra Technology (NYSE:ROM) Seasonal Chart
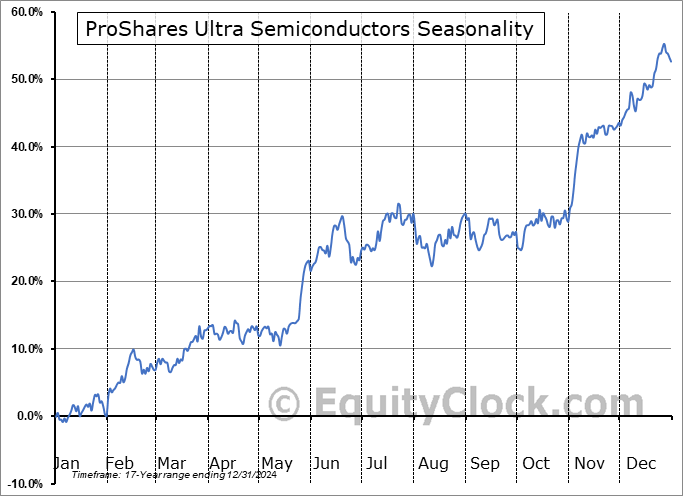
ProShares Ultra Semiconductors (NYSE:USD) Seasonal Chart
The Markets
Stocks snapped back to end the week as an upbeat reaction to earnings from Apple, the largest constituent in most large-cap benchmarks, helped to elevate the market off of the lows charted earlier in the week. The S&P 500 Index gained 2.43%, closing just below its 200-day moving average. Support at the October lows continues to solidify below 4300. Momentum indicators are showing early signs of bottoming with the Relative Strength Index (RSI) rebounding from oversold territory below 30. We still continue to wait to see how the rebound rally plays out given that it will be the ultimate tell of the strength of this market. Should the rebound reveal a lower-high below the start of year peak, the beginning of a trend of lower-lows and lower-highs will be revealed, defining a negative path that could constrain the market at least through the end of the first half of the year. We are watching levels of resistance overhead as potential rebound targets, but there is not a whole lot of faith that the benchmark will be able to overcome them given the weight that is being imposed on the market as a result of the weakness in technology. This correction in valuation has been swift and extreme, but these corrections rarely play out in just a matter of weeks and often play out over the course of months. The 2018 rate tantrum, for instance, was realized over two periods between January and April and October to December. Shorter-term downdrafts can lead to enticing opportunities to pick up exposure for a near-term bounce, but sustained rallies that span for months on end are now a thing of the past. Bottom line is to not become too attached to any positions picked up on this recent dip as we may want to be sellers again as the short-term rebound matures.

Today, in our Market Outlook to subscribers, we discuss the following:
- Weekly and monthly view of the large-cap benchmark and the level that may need to be tested before the market finds stability
- Investor Sentiment
- The change in margin debt compared to seasonal norms and what it means
- US International Trade and what is driving activity
Subscribe now and we’ll send this outlook to you.
Just released…
Our Monthly Report for February is out, providing everything that you need to know for the month(s) ahead.
Highlights in this report include:
- Equity market tendencies in the month of February
- Tracking the spread of COVID
- Rebounding demand for petroleum products
- Jobless Claims
- Leading indicators of the economy (and equity market) remaining in good shape
- Second weakest December change in Retail Sales on record
- Industrial Production
- Manufacturer sentiment
- Inflationary pressures starting to moderate
- Equity market performance surrounding the first rate hike
- Rise in prices and the downfall of mortgage interest costs in 2021
- The technical status of the S&P 500 Index
- S&P 500 Equal Weight
- Technology Sector ETF
- The battle between offense and defense
- Investor pessimism and institutional buying
- Gold is catching a bid, but for how long
- Yields
- Global equities
- Positioning for the months ahead
- Sector reviews and ratings
- Stocks that have frequently gained in the month of February
- Notable stocks and ETFs entering their period of strength in February
Subscribers can look for this report in their inbox.
Not subscribed yet? Simply signup via our subscription page at https://charts.equityclock.com/subscribe and well send this report to you.
Sentiment on Friday, as gauged by the put-call ratio, ended bearish at 1.03.

Seasonal charts of companies reporting earnings today:


S&P 500 Index


TSE Composite


| Sponsored By... |

|

