Stock Market Outlook for February 16, 2022

Shipping volumes in January fell by the most for the first month of the year on record!
*** Stocks highlighted are for information purposes only and should not be considered as advice to purchase or to sell mentioned securities. As always, the use of technical and fundamental analysis is encouraged in order to fine tune entry and exit points to average seasonal trends.
Stocks Entering Period of Seasonal Strength Today:
Subscribers – Click on the relevant link to view the full profile. Not a subscriber? Signup here.
Johnson & Johnson (NYSE:JNJ) Seasonal Chart
Loblaw Companies Ltd. (TSE:L.TO) Seasonal Chart
Invesco Senior Loan ETF (NYSE:BKLN) Seasonal Chart
The Markets
Stocks rebounded on Tuesday as news that Russia had started to pull back troops from the Ukraine border had investors encouraged that a diplomatic solution would be reached. The S&P 500 Index jumped by 1.58%, closing back above its 20 and 200-day moving averages. Previous resistance, now support, at 4450 was also surpassed as the benchmark attempts to recoup the losses recorded through the back half of last week. Momentum indicators, while higher on the day, are still showing characteristics of a bearish trend, remaining highly tenuous below their middle lines. Tuesday’s opening gap between 4410 and 4430 provides a zone of short-term support for investors to shoot off of, but this is still a market that is showing stronger reaction to zones of resistance than support. The catalyst of Tuesday’s uptick (the slight reduction of the probability of war with Russia) remains a highly uncertain event, therefore we will not attempt to gamble or predict an outcome. We will stick with our three pronged approach incorporating seasonal, technical, and fundamental analysis, which suggests a certain amount of caution in the near-term remains warranted.
Today, in our Market Outlook to subscribers, we discuss the following:
- Riskiest segments of the market rebounding
- Our commodity exposure is looking exhausted and time to rotate
- A swap of our fixed income exposure
- Producer Price Index (PPI) and the strongest increase in prices for the first month of the year since 1990
- Empire State Manufacturing Index
- Shipping volumes/expenditures and investing in the period of seasonal strength for the transportation industry
Subscribe now and we’ll send this outlook to you.
Sentiment on Tuesday, as gauged by the put-call ratio, ended slightly bullish at 0.93.
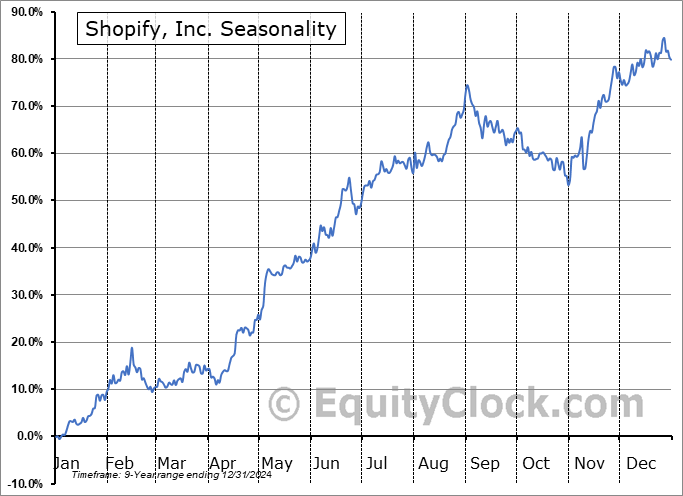
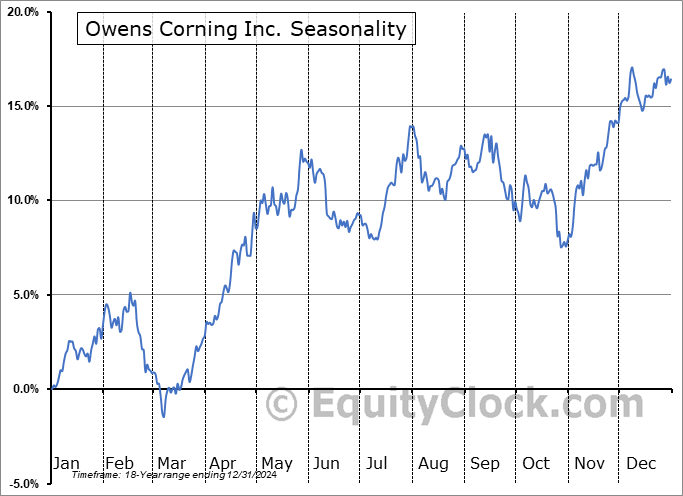
Seasonal charts of companies reporting earnings today:
S&P 500 Index
TSE Composite
| Sponsored By... |

|


