Stock Market Outlook for February 22, 2022

S&P 500 Index has crossed and closed below its 50-week moving average, the first time it has done so since February of 2020.
*** Stocks highlighted are for information purposes only and should not be considered as advice to purchase or to sell mentioned securities. As always, the use of technical and fundamental analysis is encouraged in order to fine tune entry and exit points to average seasonal trends.
Stocks Entering Period of Seasonal Strength Today:
Subscribers – Click on the relevant link to view the full profile. Not a subscriber? Signup here.
Invesco Preferred ETF (NYSE:PGX) Seasonal Chart
ProShares Ultra 7-10 Year Treasury (NYSE:UST) Seasonal Chart
Vanguard International Dividend Appreciation ETF (NASD:VIGI) Seasonal Chart
AT&T, Inc. (NYSE:T) Seasonal Chart
Charter Communications Inc. (NASD:CHTR) Seasonal Chart
Take-Two Interactive Software, Inc. (NASD:TTWO) Seasonal Chart
ProShares Ultra QQQ (NYSE:QLD) Seasonal Chart
The Markets
Stocks remained under pressure on Friday as investors continued to monitor developments pertaining to the escalating tensions between Russia and Ukraine. The S&P 500 Index closed down by just over seven-tenths of one percent, remaining below major moving averages at the 20, 50, and 200-day. Momentum indicators are on the decline again, continuing to show characteristics of a bearish trend below their middle lines. The entire market is eying significant support just below 4300, which marks the correction lows from the past eight months and it now presents the neckline to a head-and-shoulders topping pattern. The calculated downside target of the setup upon a significant breach of the aforementioned support reaches all the way down to 3780, or over 11% below the neckline. Our speculation leads us to believe that it won’t reach that far, nor amount a definitive break in the near-term, but speculation is not an investment strategy. We remain comfortable with our significantly diminished equity exposure and the market can do whatever it wants while we wait for the three prongs to our approach (seasonal, technical, and fundamental) to align again in order to become aggressive. That time may be near.
Today, in our Market Outlook to subscribers, we discuss the following:
- Weekly view of the large-cap benchmark and when we are seeking to be aggressive buyers of stocks again
- US Existing Home Sales and the strain on activity resulting from waning inventories
- Canadian Retail Sales
- Retailer inventories and why this may be becoming an issue
Subscribe now and we’ll send this outlook to you.
Sentiment on Friday, as gauged by the put-call ratio, ended bearish at 1.18.
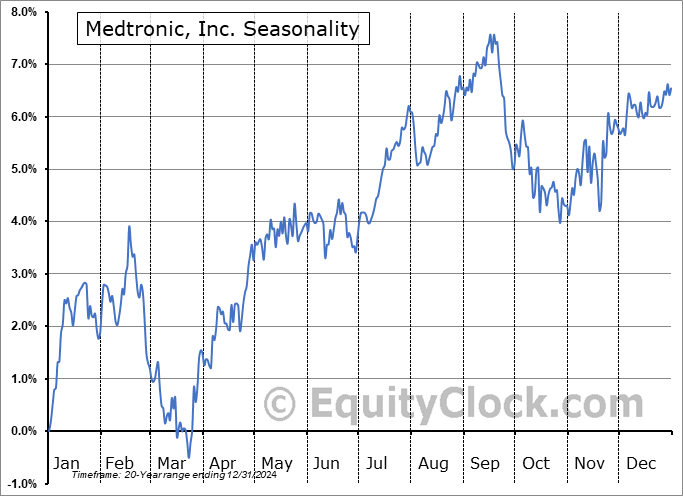
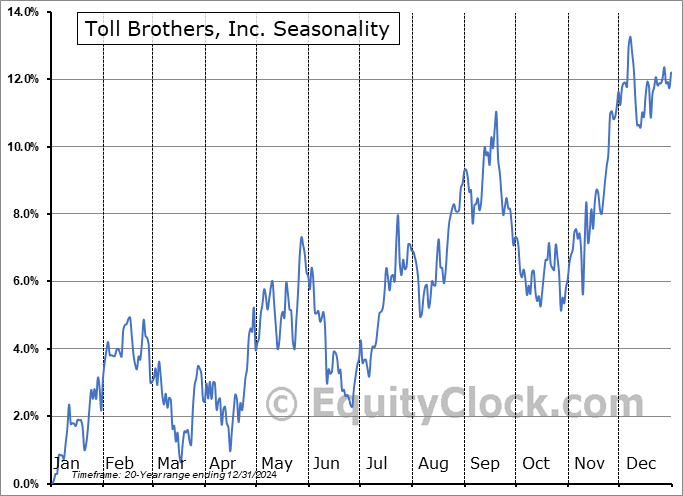
Seasonal charts of companies reporting earnings today:
S&P 500 Index
TSE Composite
| Sponsored By... |

|


