Stock Market Outlook for March 4, 2022

Classic safe-haven sectors continue to attract a bid in this market, which is why they remain on our list of market segments to Accumulate.
*** Stocks highlighted are for information purposes only and should not be considered as advice to purchase or to sell mentioned securities. As always, the use of technical and fundamental analysis is encouraged in order to fine tune entry and exit points to average seasonal trends.
Stocks Entering Period of Seasonal Strength Today:
Subscribers – Click on the relevant link to view the full profile. Not a subscriber? Signup here.

PROG Holdings, Inc. (NYSE:PRG) Seasonal Chart

Via Renewables, Inc. (NASD:VIA) Seasonal Chart

Aptus Drawdown Managed Equity ETF (AMEX:ADME) Seasonal Chart

Avient Corporation (NYSE:AVNT) Seasonal Chart

Air Products and Chemicals, Inc. (NYSE:APD) Seasonal Chart

Kadant Inc. (NYSE:KAI) Seasonal Chart

Frontline Ltd. (NYSE:FRO) Seasonal Chart

Pennsylvania REIT (NYSE:PEI) Seasonal Chart

Avista Corp. (NYSE:AVA) Seasonal Chart
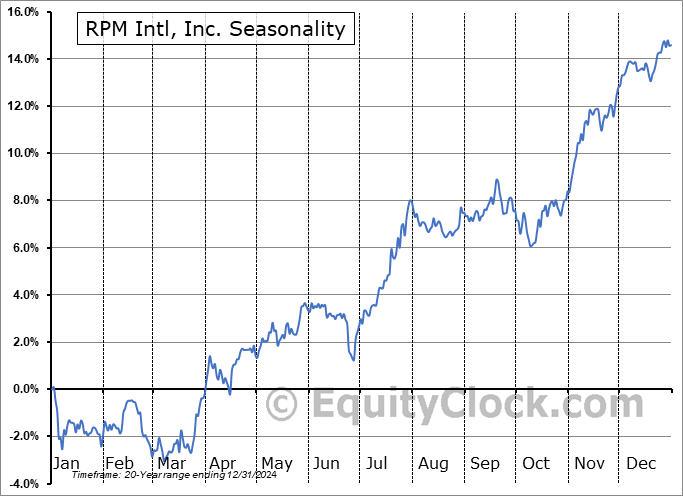
RPM Intl, Inc. (NYSE:RPM) Seasonal Chart

Old Republic Intl Corp. (NYSE:ORI) Seasonal Chart

John Wiley & Sons, Inc. Cl A (NYSE:JW/A) Seasonal Chart
The Markets
Stocks slipped on Thursday as geopolitical concerns continue to weigh and as investors prepare for the release of the monthly payroll report on Friday. The S&P 500 Index ended down by half of one percent, remaining in this volatile pattern of up one day and down the next. Resistance at the highs of the session was tested around the declining 20-day moving average at 4410. The 200-day moving average remains the formidable threat overhead around 4465. As highlighted in a recent report, typically in a market pullback, you will see an evolution of tests of major moving averages once they are broken as support. The test of the 20-day moving average as resistance was first realized on January 13th, setting the stage for a negative trajectory over the short-term, The test of the 50-day moving average was realized on February 10th, opening up the weakness to intermediate-term implications. A test and rejection of resistance at the 200-day moving average would open things up to long-term implications lasting months. In our strategy, we are primarily interested in the intermediate path spanning weeks to months and that trajectory continues to lean negative, as gauged by the direction of the declining 50-day. Positive momentum divergences can continue to be seen, indicating waning selling pressures, but they have yet to emerge from levels below their middle lines, characteristics of a bearish trend. This is still a market that is full of uncertainty and while we are long risk (stocks) for the months of March and April, pegging our bets against significant support at 4280 on the large-cap benchmark, any headline in the near-term could quickly kick us out of our recently ramped up equity exposure and we must continue to be prepared for that. Be long the market against support on the S&P 500 at 4280 and be out/conservative if below.

Today, in our Market Outlook to subscribers, we discuss the following:
- Safe-haven sectors continue to attract a bid, including Utilities
- Residential REITs
- Weekly Jobless Claims and the health of the labor market
- A look ahead to the monthly Nonfarm Payroll report
- Natural gas stockpiles and the seasonal trade in the commodity
Subscribe now and we’ll send this outlook to you.
Sentiment on Thursday, as gauged by the put-call ratio, ended bullish at 0.93.

Seasonal charts of companies reporting earnings today:


S&P 500 Index


TSE Composite


| Sponsored By... |

|

