Stock Market Outlook for March 16, 2022

Headlines pointed to a shocking plunge in manufacturer sentiment in the New York region for March, but, while not great, the non-seasonally adjusted data provides an alternate view.
*** Stocks highlighted are for information purposes only and should not be considered as advice to purchase or to sell mentioned securities. As always, the use of technical and fundamental analysis is encouraged in order to fine tune entry and exit points to average seasonal trends.
Stocks Entering Period of Seasonal Strength Today:
Subscribers – Click on the relevant link to view the full profile. Not a subscriber? Signup here.

Royal Dutch Shell Plc. B Shares (NYSE:RDS/B) Seasonal Chart

Shake Shack Inc. (NYSE:SHAK) Seasonal Chart

Axalta Coating Systems Ltd. (NYSE:AXTA) Seasonal Chart

Office Properties Income Trust (NASD:OPI) Seasonal Chart

Zendesk, Inc. (NYSE:ZEN) Seasonal Chart

Invesco International Dividend Achievers ETF (NASD:PID) Seasonal Chart

Invesco S&P 500 GARP ETF (AMEX:SPGP) Seasonal Chart

Union Pacific Corp. (NYSE:UNP) Seasonal Chart

Ulta Beauty, Inc. (NASD:ULTA) Seasonal Chart
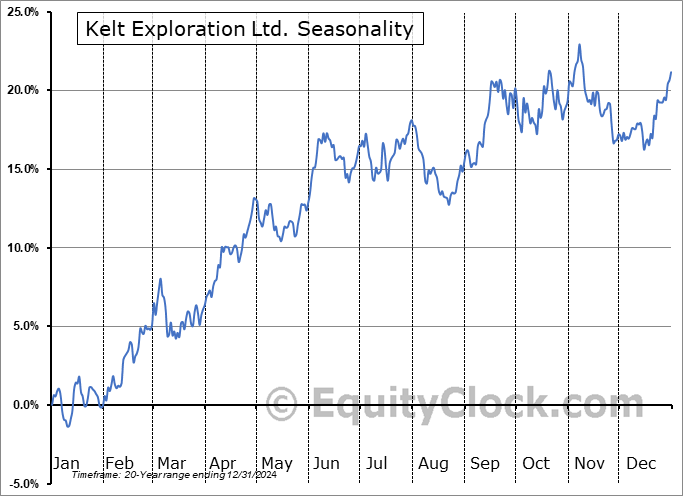
Kelt Exploration Ltd. (TSE:KEL.TO) Seasonal Chart

Lumber Liquidators Holdings, Inc. (NYSE:LL) Seasonal Chart

Dover Corp. (NYSE:DOV) Seasonal Chart

Ecopetrol SA (NYSE:EC) Seasonal Chart
The Markets
Stocks rebounded on Tuesday as investors took profits in some of the high-flying energy names and funnelled funds back into growth/technology segments of the market. The S&P 500 Index ended with a gain of 2.14%, reaching back towards previously broken support and current significant resistance at 4280. Declining trendline resistance from the past month and a half also intersects around the same level and it forms the basis of a falling wedge pattern, hinting that investors are becoming increasingly reluctant to be sellers around current levels. This is also portrayed by the absence of the waterfall declines that were standouts in the months of January and February. While selling exhaustion is implied, it appears that the market has not developed the confidence to return to long allocations, yet, after becoming the most bearish they have been since March and April of 2020. The aforementioned hurdle at 4280 remains a significant hurdle to watch as a definitive breakout above the level may force the hands of the bears and draw sidelined cash back into equities. Our playbook for 2022 has called for weakness through the first couple of months of the year followed by strength into the middle of April and then another round of weakness through the back half of the second quarter. So far, the action in the market has been fairly close to what has been forecasted and our focus presently is to take advantage of the next gyration, which is higher through the end of the quarter and into the first half of April. We will let the three prongs to our approach be the ultimate guide of what is appropriate as we seek to navigate this highly uncertain market.

Today, in our Market Outlook to subscribers, we discuss the following:
- Zooming in to an hourly look at the large-cap benchmark
- US Producer Price Index (PPI)
- Manufacturer sentiment
- Canadian Manufacturing Sales and what is influencing aggregate activity
Subscribe now and we’ll send this outlook to you.
Sentiment on Tuesday, as gauged by the put-call ratio, ended bearish at 1.07.

Seasonal charts of companies reporting earnings today:

 Inc. Seasonal Chart")


S&P 500 Index


TSE Composite


| Sponsored By... |

|

