Stock Market Outlook for February 16, 2023

Real Time Economic Calendar provided by Investing.com.
*** Stocks highlighted are for information purposes only and should not be considered as advice to purchase or to sell mentioned securities. As always, the use of technical and fundamental analysis is encouraged in order to fine tune entry and exit points to average seasonal trends.
Stocks Entering Period of Seasonal Strength Today:
Subscribers – Click on the relevant link to view the full profile. Not a subscriber? Signup here.
Invesco Variable Rate Investment Grade ETF (NASD:VRIG) Seasonal Chart

DTE Energy Company (NYSE:DTW) Seasonal Chart

Vanguard Canadian Corporate Bond ETF (TSE:VCB.TO) Seasonal Chart

VictoryShares Dividend Accelerator ETF (NASD:VSDA) Seasonal Chart

iShares U.S. Utilities ETF (NYSE:IDU) Seasonal Chart

Loblaw Companies Ltd. (TSE:L.TO) Seasonal Chart

Genpact Ltd. (NYSE:G) Seasonal Chart
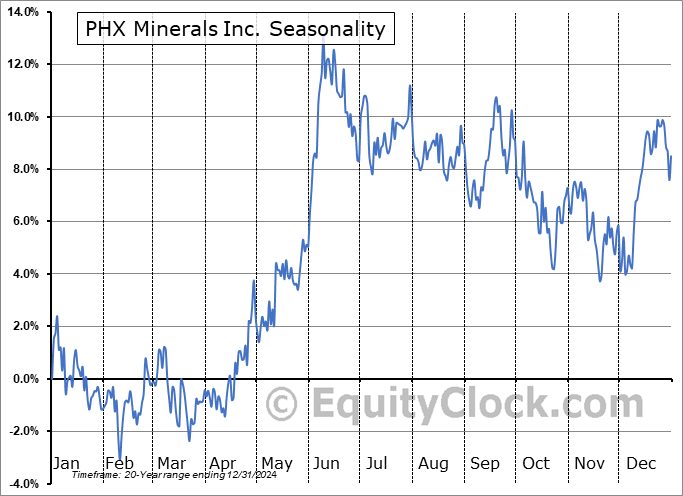
PHX Minerals Inc. (NYSE:PHX) Seasonal Chart

iShares Diversified Monthly Income ETF (TSE:XTR.TO) Seasonal Chart

BMO Monthly Income ETF (TSE:ZMI.TO) Seasonal Chart

Avalonbay Communities, Inc. (NYSE:AVB) Seasonal Chart

iShares Global Consumer Staples ETF (NYSE:KXI) Seasonal Chart

ProShares Ultra 7-10 Year Treasury (NYSE:UST) Seasonal Chart

AdvisorShares Ranger Equity Bear ETF (NYSE:HDGE) Seasonal Chart
The Markets
Stocks closed slightly higher on Wednesday, shaking off the headwind created by a stronger dollar and higher rates that followed the release of a much stronger than expected read of retail sales for January. The S&P 500 Index closed with a gain of just over a quarter of one percent, starting to firm horizontal support at 4100 that was broken in the past couple of weeks. Short-term support at the rising 20-day moving average remains intact and the coiling that has materialized in recent weeks is setting up for what could be an explosive move, either higher or lower, in the days ahead. Despite a momentum sell signal triggered with respect to MACD on Friday, downside follow-through has failed to materialize, something that is likely frustrating the bears that have been expecting a downside resolution from the short-covering rally to start the year. Major moving averages continue to converge in the 3900 to 4000 zone, providing an effective backstop to a retracement move lower, should one be realized, through the weeks ahead. Seasonal tendencies for the broad market remain negative over the weeks ahead until we get into the start of March, at which point the next bull phase of the best six months of the year between November and April begins.
Sentiment on Wednesday, as gauged by the put-call ratio, ended bullish at 0.90.Today, in our Market Outlook to subscribers, we discuss the following:
Subscribers can look for this report in their inbox or by clicking on the following link and logging in: Market Outlook for February 16 Not signed up yet? Subscribe now to receive full access to all of the research and analysis that we publish.
- The rise of the US Dollar Index
- Rebound of risk-sentiment
- US Retail Sales
- Retail industry stocks
- US Industrial Production
- Manufacturer sentiment
 Seasonal charts of companies reporting earnings today:

 Seasonal Chart")


S&P 500 Index


TSE Composite


| Sponsored By... |

|


