Stock Market Outlook for April 5, 2023

Risk-aversion in the market continues to grow.
*** Stocks highlighted are for information purposes only and should not be considered as advice to purchase or to sell mentioned securities. As always, the use of technical and fundamental analysis is encouraged in order to fine tune entry and exit points to average seasonal trends.
Stocks Entering Period of Seasonal Strength Today:
Subscribers – Click on the relevant link to view the full profile. Not a subscriber? Signup here.

Eaton Vance Tax-Advantaged Global Dividend Income Fund (NYSE:ETG) Seasonal Chart

JPMorgan U.S. Momentum Factor ETF (AMEX:JMOM) Seasonal Chart

Sleep Country Canada Holdings Inc. (TSE:ZZZ.TO) Seasonal Chart

Cohen & Steers REIT and Preferred and Income Fund, Inc. (NYSE:RNP) Seasonal Chart

Nuveen Quality Municipal Income Fund (NYSE:NAD) Seasonal Chart

iShares Global Healthcare ETF (NYSE:IXJ) Seasonal Chart

CALAMOS Convertible and High Income Fund (NASD:CHY) Seasonal Chart

Paycom Software, Inc. (NYSE:PAYC) Seasonal Chart
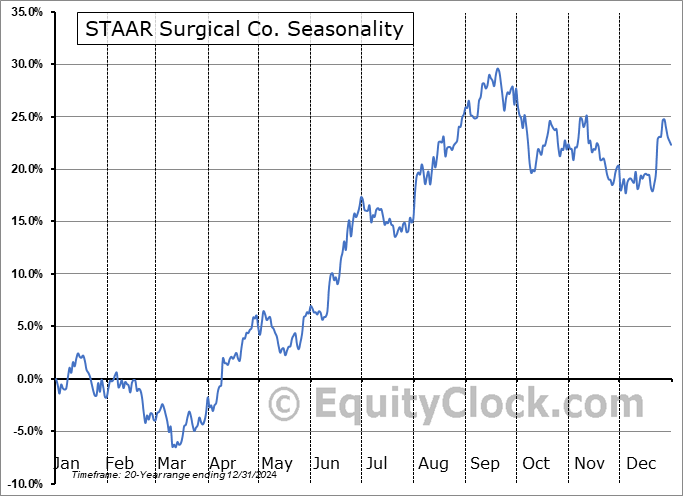
STAAR Surgical Co. (NASD:STAA) Seasonal Chart
The Markets
Stocks weakened on Tuesday as the bears once again targeted core-cyclical sectors of the market in preparation for a recession on the horizon. The S&P 500 Index slipped by just under six-tenths of one percent, reacting to the zone of resistance between 4100 and 4200. Momentum indicators remain on an upswing and the MACD Buy signal that was triggered on March 21st remains intact. The risk to stocks at this point is quite obvious, which is ongoing rejection from the horizontal range of resistance overhead, representing the level that it broke down from last year, leading to the next wave of selling pressures as the market seeks to come to a new equilibrium. Support continues to be pegged around the December low at 3764.

Today, in our Market Outlook to subscribers, we discuss the following:
- There are clearly areas of the market to be cautious of, while others are providing the leeway to remain exposed
- Gold/Copper ratio
- Job Openings and Labor Turnover Survey
- US Construction Spending
- US Factory Orders
Subscribers can look for this report in their inbox or by clicking on the following link and logging in: Market Outlook for April 5
Not signed up yet? Subscribe now to receive full access to all of the research and analysis that we publish.
Sentiment on Tuesday, as gauged by the put-call ratio, ended bearish at 1.12. 
Seasonal charts of companies reporting earnings today:


S&P 500 Index


TSE Composite


| Sponsored By... |

|


