Stock Market Outlook for May 10, 2023

While dividend ETFs may seem enticing while the broader market trades sideways, they have some of the most threatening charts in the market as they roll over below their all-time highs.
*** Stocks highlighted are for information purposes only and should not be considered as advice to purchase or to sell mentioned securities. As always, the use of technical and fundamental analysis is encouraged in order to fine tune entry and exit points to average seasonal trends.
Stocks Entering Period of Seasonal Strength Today:
Subscribers – Click on the relevant link to view the full profile. Not a subscriber? Signup here.
ECN Capital Corp. (TSE:ECN.TO) Seasonal Chart
SPDR Barclays Long Term Corporate Bond ETF (AMEX:SPLB) Seasonal Chart
Vanguard Long-Term Corporate Bond ETF (NASD:VCLT) Seasonal Chart
Vanguard Long-Term Government Bond ETF (NASD:VGLT) Seasonal Chart
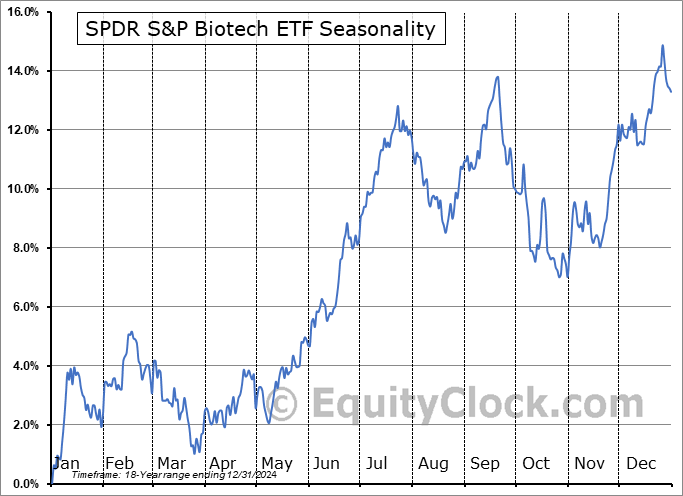
SPDR S&P Biotech ETF (NYSE:XBI) Seasonal Chart
SPDR S&P Software & Services ETF (NYSE:XSW) Seasonal Chart
Trade Desk Inc. (NASD:TTD) Seasonal Chart
Automotive Properties REIT (TSE:APR/UN.TO) Seasonal Chart
iShares Morningstar Large-Cap Growth ETF (NYSE:ILCG) Seasonal Chart
Invesco S&P 500 Momentum ETF (AMEX:SPMO) Seasonal Chart
SPDR S&P Internet ETF (AMEX:XWEB) Seasonal Chart
Intuit, Inc. (NASD:INTU) Seasonal Chart
Ameresco Inc. (NYSE:AMRC) Seasonal Chart
H & R Block, Inc. (NYSE:HRB) Seasonal Chart
Invesco DWA SmallCap Momentum ETF (NASD:DWAS) Seasonal Chart
iShares Nasdaq Biotechnology ETF (NASD:IBB) Seasonal Chart
Vanguard Mega Cap Growth ETF (NYSE:MGK) Seasonal Chart
The Markets
Stocks closed generally lower on Tuesday as investors wait for the outcome of debt ceiling negotiations in the US between Republicans and Democrats. The S&P 500 Index ended with a loss of just less than half of one percent, continuing to struggle in the range of resistance between 4100 and 4200. Support remains at the congestion of major moving averages between 3950 and 4050. It is becoming increasingly apparent that the market is in need of a catalyst to either breakout above the 100-point band of resistance or breakdown below the 100-point band of support; until this is seen, the grind continues. Momentum indicators continue to point lower and MACD remains on a sell signal, not providing anything particularly enticing to be aggressively bullish of stocks from a technical viewpoint.
Today, in our Market Outlook to subscribers, we discuss the following:
- Dividend ETFs
- US Wholesale Inventories
- The trend of High-Yield Spreads
- Normalization of treasury yield spreads at the long-end of the curve
Subscribers can look for this report in their inbox or by clicking on the following link and logging in: Market Outlook for May 10
Not signed up yet? Subscribe now to receive full access to all of the research and analysis that we publish.
Sentiment on Tuesday, as gauged by the put-call ratio, ended bullish at 0.90.
Seasonal charts of companies reporting earnings today:
S&P 500 Index
TSE Composite
| Sponsored By... |

|


