Stock Market Outlook for August 22, 2023

Breadth indicators not yet showing characteristics of a sustainable rising path for stocks.
*** Stocks highlighted are for information purposes only and should not be considered as advice to purchase or to sell mentioned securities. As always, the use of technical and fundamental analysis is encouraged in order to fine tune entry and exit points to average seasonal trends.
Stocks Entering Period of Seasonal Strength Today:
Subscribers Click on the relevant link to view the full profile. Not a subscriber? Signup here.

Civitas Resources, Inc. (NYSE:CIVI) Seasonal Chart

VanEck Vectors Oil Refiners ETF (AMEX:CRAK) Seasonal Chart

iShares Core S&P U.S. Total Market Index ETF (CAD-Hedged) (TSE:XUH.TO) Seasonal Chart

Chevron Corp. (NYSE:CVX) Seasonal Chart

US Global Jets ETF (AMEX:JETS) Seasonal Chart

Methanex Corp. (NASD:MEOH) Seasonal Chart

Allegiant Travel Co. (NASD:ALGT) Seasonal Chart

Phillips 66 (NYSE:PSX) Seasonal Chart

Goodyear Tire & Rubber Co. (NASD:GT) Seasonal Chart
The Markets
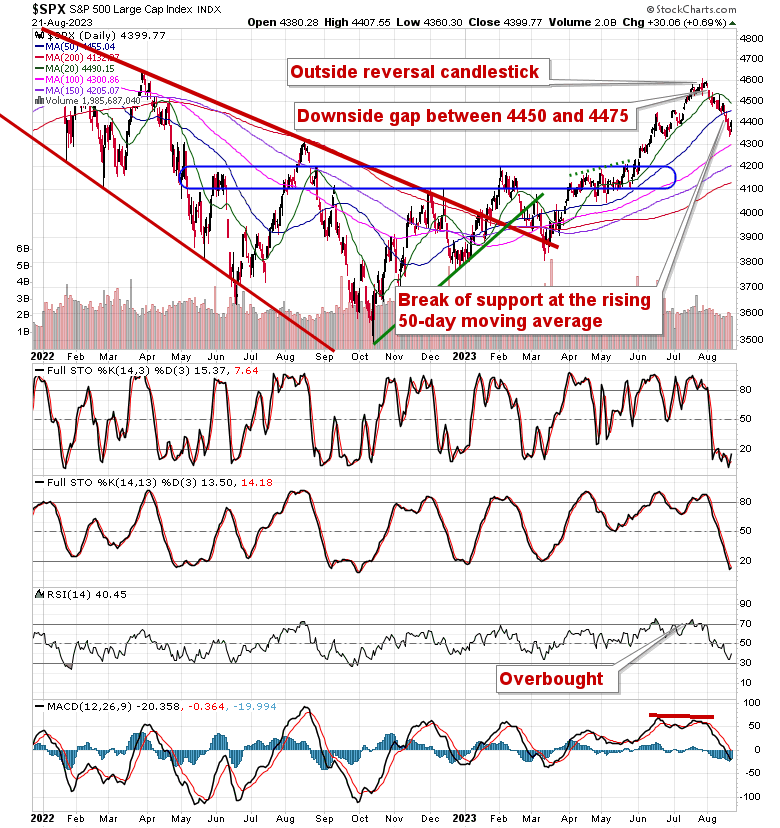
Stocks rebounded on Monday as they start to show the type of positivity that is normal surrounding the upcoming Labor Day holiday. The S&P 500 Index gained just less than seven-tenths of one percent, starting to reach back towards the levels of implied resistance at the 20 and 50-day moving averages at 4490 and 4455, respectively. Momentum indicators are starting to show signs of curling higher from their recent slide with Stochastics attempting to emerge from oversold territory below 20. It would be very difficult for the bears to maintain the negative short-term trajectory of stocks into the last holiday of the summer season given the desire of portfolio managers to maintain a neutral bias while they are away from their desks. Still, the broader period of volatility/weakness continues through the end of the third quarter, suggesting that the near-term reprieve is likely to just represent a pause in this correction that could see its lows anywhere down to 4200 while still maintaining a rising intermediate path. Major moving averages at the 100 and 200-day remain below this market, presenting positions to catch it if and when it falls. It would take a definitive break of this cloud of support to define an alternate intermediate-term trajectory.
Today, in our Market Outlook to subscribers, we discuss the following:
- Rollover of country ETFs indicative of the loss of momentum in the market
- Breadth indicators not yet showing characteristics of a sustainable bullish trend
- Our weekly chart books update: Find out how banks and cryptocurrencies rank in this week’s look
Subscribers can look for this report in their inbox or by clicking on the following link and logging in: Market Outlook for August 22
Not signed up yet? Subscribe now to receive full access to all of the research and analysis that we publish.
Want to know which areas of the market to buy or sell? Our Weekly Chart Books have just been updated, providing a clear Accumulate, Avoid, or Neutral rating for currencies, cryptocurrencies, commodities, broad markets, and subsectors/industries of the market. Subscribers can login and click on the relevant links to access.
- Currencies
- Cryptocurrencies
- Commodities
- Major Benchmarks
- Sub-sectors / Industries
- ETFs: Bonds | Commodities | Equity Markets | Industries | Sectors
Subscribe now.
Sentiment on Monday, as gauged by the put-call ratio, ended slightly bullish at 0.91.

Seasonal charts of companies reporting earnings today: 


S&P 500 Index


TSE Composite


| Sponsored By... |

|


