Stock Market Outlook for August 28, 2023

Breakout from trend channel resistance on the US Dollar Index threatens to impose a headwind against stocks moving forward.
*** Stocks highlighted are for information purposes only and should not be considered as advice to purchase or to sell mentioned securities. As always, the use of technical and fundamental analysis is encouraged in order to fine tune entry and exit points to average seasonal trends.
Stocks Entering Period of Seasonal Strength Today:
Subscribers Click on the relevant link to view the full profile. Not a subscriber? Signup here.

iShares S&P U.S. Mid-Cap Index ETF (CAD-Hedged) (TSE:XMH.TO) Seasonal Chart

Oppenheimer Large Cap Revenue ETF (NYSE:RWL) Seasonal Chart

iShares Transportation Average ETF (NYSE:IYT) Seasonal Chart

Ryder System, Inc. (NYSE:R) Seasonal Chart
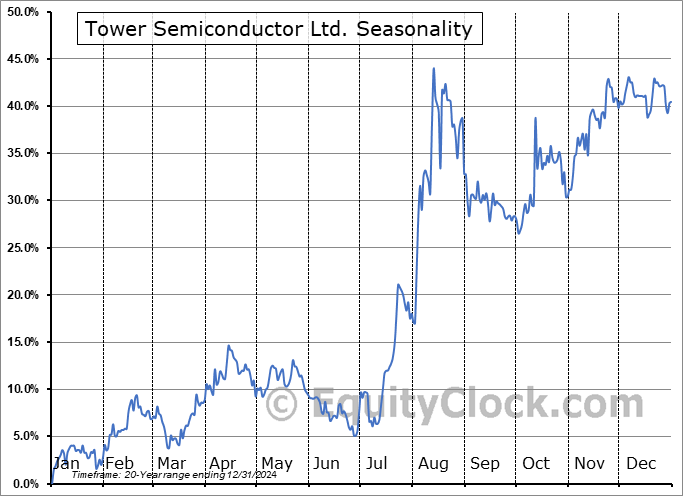
Tower Semiconductor Ltd. (NASD:TSEM) Seasonal Chart
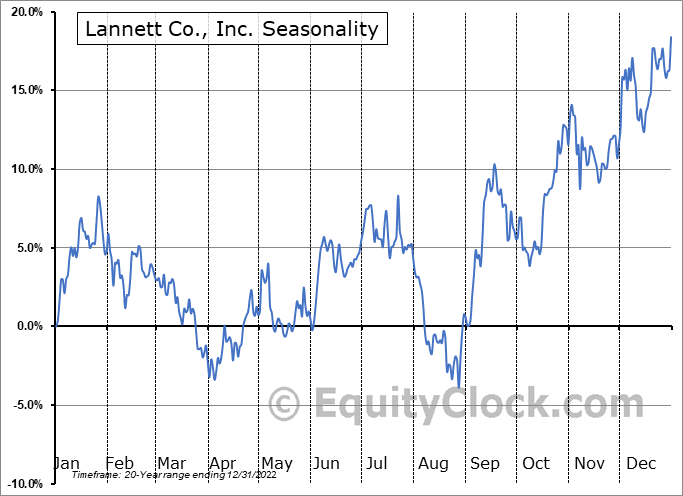
Lannett Co., Inc. (NYSE:LCI) Seasonal Chart

Delta Air Lines Inc. (NYSE:DAL) Seasonal Chart

Thor Industries, Inc. (NYSE:THO) Seasonal Chart

SPDR Russell 1000 Low Volatility Focus ETF (AMEX:ONEV) Seasonal Chart
The Markets
Stocks closed higher on Friday, stabilizing following Thursday’s significant reversal that confirmed the 50-day moving average as a point of resistance. The large-cap benchmark ended with a gain of two-thirds of one percent, charting a bit of an indecisive doji candlestick below the aforementioned barrier at the intermediate-term moving average. The 20-day moving average is now crossing below the equivalent threshold and the current technical state now increases the probability that the market will run a full retracement of its June and July breakout move above 4200 by the end of this period of seasonal weakness. A pullback to the aforementioned zone has been the fair assumption of the magnitude of the pullback during this normal period of volatility/weakness that spans the months of August and September. The Relative Strength Index (RSI) is sitting below its middle line, adopting characteristics of a bearish trend following a prolonged period between March and August showing bullish characteristics. While a reprieve in selling pressures continues to be sought surrounding the normally upbeat Labor day holiday period, the broader period of seasonal weakness that concludes by the end of September/beginning of October still leaves reason for caution in portfolio positioning.

Today, in our Market Outlook to subscribers, we discuss the following:
- Weekly look at the large-cap benchmark
- US Dollar and its influence on the performance of stock and market volatility
- Automobile industry
- Airline industry
Subscribers can look for this report in their inbox or by clicking on the following link and logging in: Market Outlook for August 28
Not signed up yet? Subscribe now to receive full access to all of the research and analysis that we publish.
Sentiment on Friday, as gauged by the put-call ratio, ended bearish at 1.11.

Seasonal charts of companies reporting earnings today:


S&P 500 Index


TSE Composite


| Sponsored By... |

|


