Stock Market Outlook for September 1, 2023

The S&P 500 Index has fallen by an average of 0.5% in September in what is considered to be the weakest and most volatile month of the year for stocks.
*** Stocks highlighted are for information purposes only and should not be considered as advice to purchase or to sell mentioned securities. As always, the use of technical and fundamental analysis is encouraged in order to fine tune entry and exit points to average seasonal trends.
Stocks Entering Period of Seasonal Strength Today:
Subscribers Click on the relevant link to view the full profile. Not a subscriber? Signup here.

Invesco Dow Jones Industrial Average Dividend ETF (AMEX:DJD) Seasonal Chart

iShares MSCI EAFE ESG Optimized ETF (NASD:ESGD) Seasonal Chart

Pacer Global Cash Cows Dividend ETF (AMEX:GCOW) Seasonal Chart
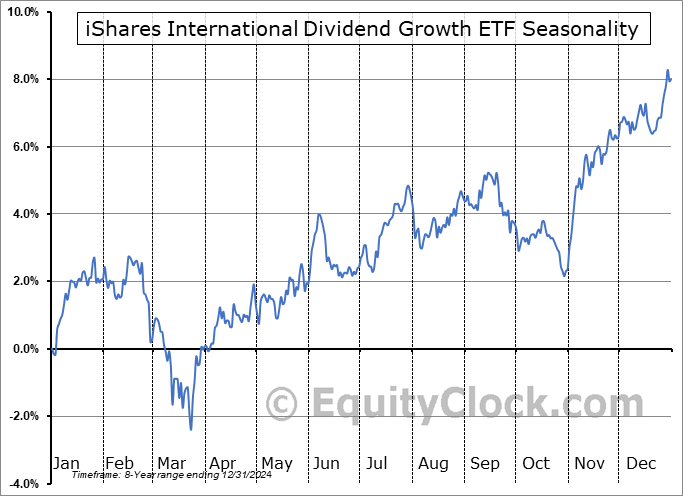
iShares International Dividend Growth ETF (AMEX:IGRO) Seasonal Chart

Invesco KBW Regional Banking ETF (NASD:KBWR) Seasonal Chart

General Electric Co. (NYSE:GE) Seasonal Chart

Pfizer, Inc. (NYSE:PFE) Seasonal Chart

Hain Celestial Group, Inc. (NASD:HAIN) Seasonal Chart

JetBlue Airways Corp. (NASD:JBLU) Seasonal Chart

Chatham Lodging Trust (NYSE:CLDT) Seasonal Chart

BMO US Dividend ETF (TSE:ZDY.TO) Seasonal Chart

Carnival Corp. (NYSE:CCL) Seasonal Chart

Vanguard Mega Cap Value ETF (NYSE:MGV) Seasonal Chart

SPDR MSCI ACWI IMI ETF (AMEX:SPGM) Seasonal Chart
The Markets
Stocks slipped slightly into the final trading day of August, capping off what had been a negative month overall for equity market benchmarks. The S&P 500 Index ended with a loss of less than two-tenths of one percent, remaining above previous resistance at its 20 and 50-day moving averages. Downside gap resistance between 4550 and 4575 remains a significant threat in the way of the continuation of the recent advance during what is traditionally a period of volatility/weakness for stocks in August and September. Momentum indicators are on the upswing following their August slide, but are showing slight signs of struggle reaching and sustaining levels above their middle lines. Beyond the normal positivity that runs into the period surrounding the Labor Day holiday, weakness returns in the back half of September during what is the weakest time of the year for the market.

Today, in our Market Outlook to subscribers, we discuss the following:
- Monthly look at the large-cap index
- Average tendencies for stocks in September
- Margin debt and investor positioning
- Weekly Jobless Claims and the health of the labor market
- A look ahead to September’s Non-Farm Payroll report
- Natural gas
Subscribers can look for this report in their inbox or by clicking on the following link and logging in: Market Outlook for September 1
Not signed up yet? Subscribe now to receive full access to all of the research and analysis that we publish.
For the month ahead, the large-cap benchmark has fallen by half of one percent (0.5%) in September over the past 20 years with only 55% of periods showing a positive result. Performance for the period is far from even with the weakest time of the month and the year occurring in the final couple of weeks of September as portfolio managers re-balance their books ahead of the busier fourth quarter for trading activity. We break down everything that you need to know in our just released monthly report for September.


Just released…
Our monthly report for September is out, providing you with everything that you need to know for the month(s) ahead.
Highlights in this report include:
- Equity market tendencies in the month of September
- Watching the level of liquidity the Fed continues to provide to the market
- Yields spreads
- Shipping economy already in recession
- Struggling business loan activity starting to spread to the consumer?
- Weekly jobless claims continue to provide the hallmarks of a pre-recessionary period
- Extreme heat helped to support industrial production through the typically slower month of July
- Copper expressing a cautionary tale pertaining to the industrial economy
- Struggle in the manufacturing economy being driven by the downfall of consumer goods orders
- Cracks emerging in the formerly resilient consumer
- Retailers still unable to bring inventories under control
- The inflationary battle not getting any better for the consumer
- The second of the weakest two-week spans in the equity market
- S&P 500 Valuation
- Best time in the presidential cycle for bonds
- Rollover of corporate bond prices
- US Dollar
- Investors have become risk-averse cyclical/high beta market segments
- Our list of all segments of the market to either Accumulate or Avoid, along with relevant ETFs
- Positioning for the months ahead
- Sector Reviews and Ratings
- Stocks that have Frequently Gained in the Month of September
- Notable Stocks and ETFs Entering their Period of Strength in September
Subscribers can look for this 104-page report in their inbox or download it from the archive at https://charts.equityclock.com/.
Not subscribed yet? Signup now to receive access to this report and all of the research that we publish.
Sentiment on Thursday, as gauged by the put-call ratio, ended close to neutral at 0.96.

Seasonal charts of companies reporting earnings today:
- No significant earnings scheduled for today.
S&P 500 Index


TSE Composite


| Sponsored By... |

|


