Stock Market Outlook for September 5, 2023

While the market perceived the economic data released on Friday to be strong, we have an opposing view.
*** Stocks highlighted are for information purposes only and should not be considered as advice to purchase or to sell mentioned securities. As always, the use of technical and fundamental analysis is encouraged in order to fine tune entry and exit points to average seasonal trends.
Stocks Entering Period of Seasonal Strength Today:
Subscribers Click on the relevant link to view the full profile. Not a subscriber? Signup here.

BMO US Dividend Hedged to CAD ETF (TSE:ZUD.TO) Seasonal Chart

Vanguard Russell 1000 Value ETF (NASD:VONV) Seasonal Chart

SPDR S&P Regional Banking ETF (NYSE:KRE) Seasonal Chart

Exxon Mobil Corp. (NYSE:XOM) Seasonal Chart

WisdomTree SmallCap Dividend Fund (NYSE:DES) Seasonal Chart
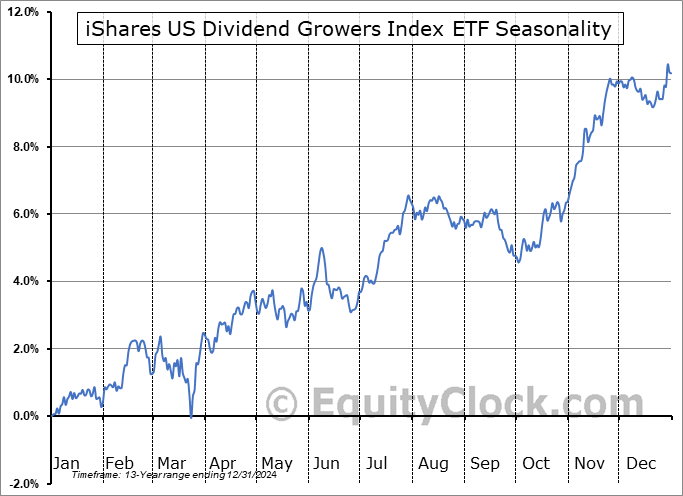
iShares US Dividend Growers Index ETF (CAD-Hedged) (TSE:CUD.TO) Seasonal Chart

Genesco, Inc. (NYSE:GCO) Seasonal Chart

Hawaiian Electric Industries Inc. (NYSE:HE) Seasonal Chart

Telefonica SA (NYSE:TEF) Seasonal Chart

General Motors Co. (NYSE:GM) Seasonal Chart

Nike Inc. (NYSE:NKE) Seasonal Chart

IntercontinentalExchange Group, Inc. (NYSE:ICE) Seasonal Chart
The Markets
Stocks edged mildly higher on Friday as the market showed a fairly peculiar reaction to a rather mixed set of economic data. The S&P 500 Index ended the day with a gain of two-tenths of one percent, charting a bit of a doji indecision candlestick heading into the last long weekend of summer. The benchmark has achieved the positivity that is normal heading into the Labor Day holiday, but near-term signs of buying exhaustion in the past couple of sessions suggests that the positivity binge may be nearing an end. Portfolio managers would be reluctant to hold negative bets while away from their desks, leading to this neutralization push that can carry stocks higher from around the middle of August into the beginning of September. However, the weakest time of the year for the market is directly ahead, spanning the last couple of weeks of the the third quarter and levels on the S&P 500 Index back to the June breakout point at 4200 remain fair game as part of this normal period of volatility/weakness during the third quarter. Downside gap resistance between 4550 and 4575 remains a significant threat overhead. We’ll try to keep an open mind heading into this back-to-school month, but given that the market has performed as it normally does through the summer rally period and through the first half of the period of volatility in August and September, we have no reason to suspect a deviation against this seasonal norm ahead.

Today, in our Market Outlook to subscribers, we discuss the following:
- Weekly look at the large-cap benchmark
- The rise of the US Dollar Index and Treasury Yields on Friday
- US Employment Situation
- Canada Gross Domestic Product (GDP)
- Stocks that have gained or lost in every September over their trading history
Subscribers can look for this report in their inbox or by clicking on the following link and logging in: Market Outlook for September 5
Not signed up yet? Subscribe now to receive full access to all of the research and analysis that we publish.
Just released…
Our monthly report for September is out, providing you with everything that you need to know for the month(s) ahead.
Highlights in this report include:
- Equity market tendencies in the month of September
- Watching the level of liquidity the Fed continues to provide to the market
- Yields spreads
- Shipping economy already in recession
- Struggling business loan activity starting to spread to the consumer?
- Weekly jobless claims continue to provide the hallmarks of a pre-recessionary period
- Extreme heat helped to support industrial production through the typically slower month of July
- Copper expressing a cautionary tale pertaining to the industrial economy
- Struggle in the manufacturing economy being driven by the downfall of consumer goods orders
- Cracks emerging in the formerly resilient consumer
- Retailers still unable to bring inventories under control
- The inflationary battle not getting any better for the consumer
- The second of the weakest two-week spans in the equity market
- S&P 500 Valuation
- Best time in the presidential cycle for bonds
- Rollover of corporate bond prices
- US Dollar
- Investors have become risk-averse cyclical/high beta market segments
- Our list of all segments of the market to either Accumulate or Avoid, along with relevant ETFs
- Positioning for the months ahead
- Sector Reviews and Ratings
- Stocks that have Frequently Gained in the Month of September
- Notable Stocks and ETFs Entering their Period of Strength in September
Subscribers can look for this 104-page report in their inbox or download it from the archive at https://charts.equityclock.com/.
Not subscribed yet? Signup now to receive access to this report and all of the research that we publish.
With the new month upon us and as we celebrate the release of our monthly report for September, today we release our screen of all of the stocks that have gained in every September over their trading history. While we at Equity Clock focus on a three-pronged approach (seasonal, technical, and fundamental analysis) to gain exposure to areas of the market that typically perform well over intermediate (2 to 6 months) timeframes, we know that stocks that have a 100% frequency of success for a particular month is generally of interest to those pursuing a seasonal investment strategy. Below are the results:

And how about those securities that have never gained in this ninth month of the year, here they are:

*Note: None of the results highlighted above have the 20 years of data that we like to see in order to accurately gauge the annual recurring, seasonal influences impacting an investment, therefore the reliability of the results should be questioned. We present the above list as an example of how our downloadable spreadsheet available to yearly subscribers can be filtered.
Sentiment on Friday, as gauged by the put-call ratio, ended slightly bearish at 1.05. There was evidence of some hedging taking place before market participants stepped back from their desks for the last long weekend of summer.

Seasonal charts of companies reporting earnings today:


S&P 500 Index


TSE Composite


| Sponsored By... |

|


