Stock Market Outlook for September 7, 2023

Shares of Apple are showing sharp rejection from gap resistance between $187 and $190, suggesting the start of a declining trend for the tech titan.
*** Stocks highlighted are for information purposes only and should not be considered as advice to purchase or to sell mentioned securities. As always, the use of technical and fundamental analysis is encouraged in order to fine tune entry and exit points to average seasonal trends.
Stocks Entering Period of Seasonal Strength Today:
Subscribers Click on the relevant link to view the full profile. Not a subscriber? Signup here.

BMO Covered Call Dow Jones Industrial Average Hedged to CAD ETF (TSE:ZWA.TO) Seasonal Chart

BMO International Dividend ETF (TSE:ZDI.TO) Seasonal Chart

Invesco KBW Property & Casualty Insurance ETF (NASD:KBWP) Seasonal Chart

Vanguard Dividend Appreciation ETF (NYSE:VIG) Seasonal Chart

Vanguard High Dividend Yield ETF (NYSE:VYM) Seasonal Chart

Invesco S&P SmallCap Low Volatility ETF (AMEX:XSLV) Seasonal Chart

BMO MSCI EAFE Index ETF (TSE:ZEA.TO) Seasonal Chart
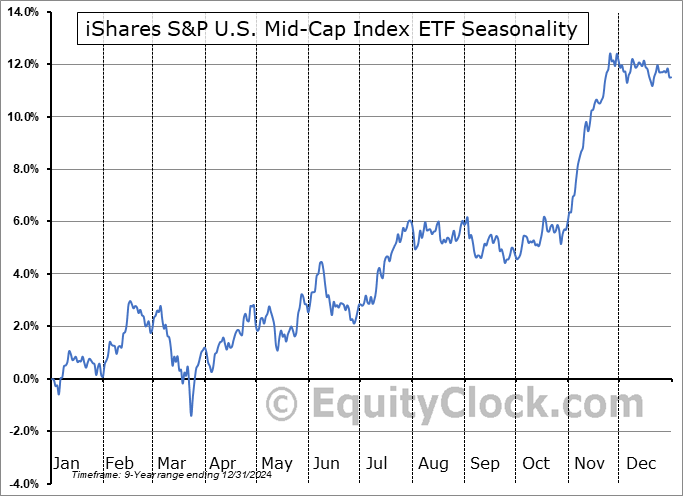
iShares S&P U.S. Mid-Cap Index ETF (TSE:XMC.TO) Seasonal Chart

iShares U.S. High Dividend Equity Index ETF (TSE:XHU.TO) Seasonal Chart

Invesco S&P SmallCap Quality ETF (AMEX:XSHQ) Seasonal Chart

Chubb Ltd. (NYSE:CB) Seasonal Chart

Laurentian Bank Of Canada (TSE:LB.TO) Seasonal Chart

Ameriprise Financial Inc. (NYSE:AMP) Seasonal Chart

Renaissance RE Holdings Ltd. (NYSE:RNR) Seasonal Chart

Hibbett Sports Inc. (NASD:HIBB) Seasonal Chart
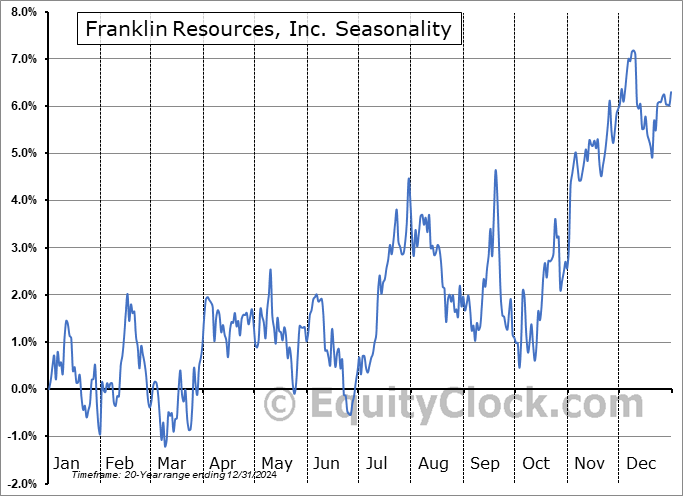
Franklin Resources, Inc. (NYSE:BEN) Seasonal Chart

Monarch Casino & Resort, Inc. (NASD:MCRI) Seasonal Chart

Mesa Laboratories, Inc. (NASD:MLAB) Seasonal Chart

Vanguard FTSE Global All Cap ex Canada Index ETF (TSE:VXC.TO) Seasonal Chart
The Markets
Stocks continued to roll over on Wednesday as the volatility/weakness that is normal of the last two months of the third quarter returns following the short-term positivity that surrounded the Labor Day holiday. The S&P 500 Index ended the day down by seven-tenths of one percent, losing support, once again, at the 50-day moving average. Momentum indicators are increasingly rolling over below their middle lines as characteristics of a bearish trend start to become adopted. As has been highlighted previously, levels down to the June breakout point at 4200 remain fair game as part of this normal period of volatility/weakness in August and September, allowing the more intermediate rising trend of the market to remain intact ahead of the start of the best six months of the year for stocks that starts in October. Between now and then, caution is prudent given the unfavourable risk-reward through the weeks ahead.

Today, in our Market Outlook to subscribers, we discuss the following:
- The downfall of Apple (AAPL) on Wednesday
- US Vehicle Sales
- US Factory Orders
- The rollover of the price of Copper
- Copper-Gold ratio
Subscribers can look for this report in their inbox or by clicking on the following link and logging in: Market Outlook for September 7
Not signed up yet? Subscribe now to receive full access to all of the research and analysis that we publish.
Sentiment on Wednesday, as gauged by the put-call ratio, ended bearish at 1.24.

Seasonal charts of companies reporting earnings today:
 Seasonal Chart")


S&P 500 Index


TSE Composite


| Sponsored By... |

|


