Stock Market Outlook for September 11, 2023

The surge of Canadian unemployment this year is reminiscent of an economic recession.
*** Stocks highlighted are for information purposes only and should not be considered as advice to purchase or to sell mentioned securities. As always, the use of technical and fundamental analysis is encouraged in order to fine tune entry and exit points to average seasonal trends.
Stocks Entering Period of Seasonal Strength Today:
Subscribers Click on the relevant link to view the full profile. Not a subscriber? Signup here.
Bank of New York Mellon Corp (NYSE:BK) Seasonal Chart
HP Inc. (NYSE:HPQ) Seasonal Chart
US Bancorp (NYSE:USB) Seasonal Chart
Prudential Financial Inc. (NYSE:PRU) Seasonal Chart
PBF Energy Inc. (NYSE:PBF) Seasonal Chart
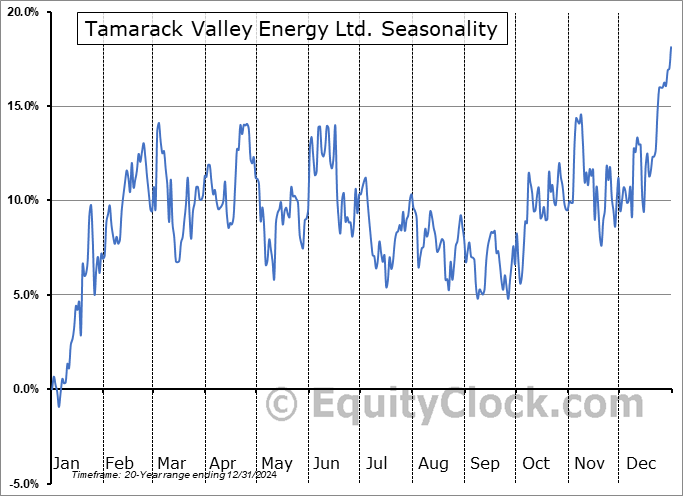
Tamarack Valley Energy Ltd. (TSE:TVE.TO) Seasonal Chart
Brand Leaders Plus Income ETF (TSE:HBF.TO) Seasonal Chart
The Markets
Stocks closed around the flat-line on Friday as the bulls showed their inability to gain traction amidst this period of normal volatility/weakness for stocks. The S&P 500 Index closed higher by just over a tenth of one percent, remaining pinned below resistance at the 50-day moving average at 4478. The appearance of a lower-high below the 52-week high charted at the start of August provides the appearance of a topping pattern, the downside resolution of which could see a giveback of much of the strength that had been achieved through the spring and into the summer. A level of horizontal support can be pegged around 4335, providing the basis for a neckline to a head-and-shoulders setup. Momentum indicators are rolling over around their middle lines, starting to adopt characteristics of a bearish trend. Levels down to the June breakout point at 4200 remain fair game as part of this period of volatility/weakness that spans the months of August and September, but, so long as this horizontal barrier holds, the pullback that remains underway presents a healthy reset to get re-involved in the market for the best six month of the year timeframe that starts in October.
Today, in our Market Outlook to subscribers, we discuss the following:
- Weekly look at the large-cap benchmark
- Core-cyclical sectors at critical hurdles
- The significant resistance for the Technology sector
- Canada Labour Force Survey
- US Wholesale Sales and Inventories
Subscribers can look for this report in their inbox or by clicking on the following link and logging in: Market Outlook for September 11
Not signed up yet? Subscribe now to receive full access to all of the research and analysis that we publish.
Sentiment on Friday, as gauged by the put-call ratio, ended bearish at 1.08.
Seasonal charts of companies reporting earnings today:
S&P 500 Index
TSE Composite
| Sponsored By... |

|


