Stock Market Outlook for September 12, 2023

The US Dollar Index is breaking out of its trend of lower-lows and lower-highs and this poses risks to stocks and commodities.
*** Stocks highlighted are for information purposes only and should not be considered as advice to purchase or to sell mentioned securities. As always, the use of technical and fundamental analysis is encouraged in order to fine tune entry and exit points to average seasonal trends.
Stocks Entering Period of Seasonal Strength Today:
Subscribers Click on the relevant link to view the full profile. Not a subscriber? Signup here.
RCM Technologies, Inc. (NASD:RCMT) Seasonal Chart
Schwab US Dividend Equity ETF (AMEX:SCHD) Seasonal Chart
BMO Dow Jones Industrial Average Hedged to CAD Index ETF (TSE:ZDJ.TO) Seasonal Chart
Air Products and Chemicals, Inc. (NYSE:APD) Seasonal Chart
Steelcase, Inc. (NYSE:SCS) Seasonal Chart
Ingredion Inc. (NYSE:INGR) Seasonal Chart
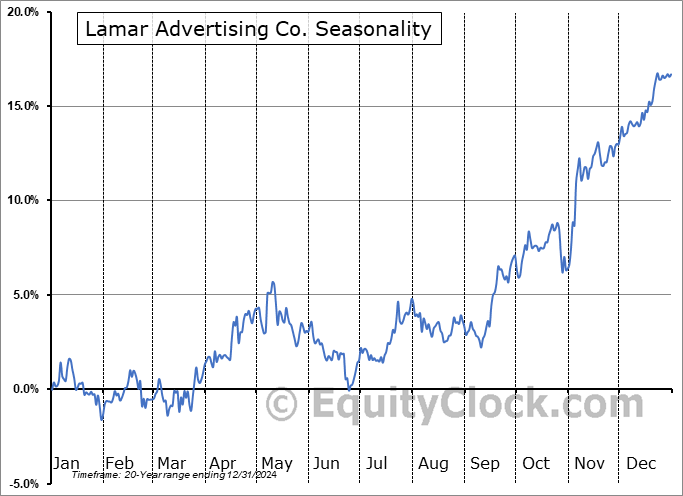
Lamar Advertising Co. (NASD:LAMR) Seasonal Chart
Paychex, Inc. (NASD:PAYX) Seasonal Chart
The Markets
Stocks closed higher to start the week as investors brace for a number of key economic data points through the week ahead. The S&P 500 Index closed with a gain of two-thirds of one percent, bouncing from a point of support around the 20-day moving average. While the price action over the past couple of sessions has brought some relief to the direction of momentum indicators, MACD remains on the verge of charting a bearish crossover versus its signal line. The implied sell signal is being hinted around the mid-point to the momentum indicator’s span, which would start to ingrain characteristics of a bearish trend if confirmed. Gap resistance between 4550 and 4575 continues to act as a cap to this market as the digestion of the summer rally gains attributed to the normal third quarter volatility/weakness progresses. Remember, levels down to June’s breakout point at 4200 remain fair game in order to keep the more intermediate rising path of the market stemming from the October low intact. Above this hurdle, using weakness between now and the middle of October to accumulate desired equity exposure may provide the desired setup for the best six month of the year timeframe for stocks.
Today, in our Market Outlook to subscribers, we discuss the following:
- Abnormally low level of the VIX for this time of year
- Our weekly chart books update along with our list of all segments of the market to either Accumulate or Avoid
- US Dollar Index
- Uranium
Subscribers can look for this report in their inbox or by clicking on the following link and logging in: Market Outlook for September 12
Not signed up yet? Subscribe now to receive full access to all of the research and analysis that we publish.
Want to know which areas of the market to buy or sell? Our Weekly Chart Books have just been updated, providing a clear Accumulate, Avoid, or Neutral rating for currencies, cryptocurrencies, commodities, broad markets, and subsectors/industries of the market. Subscribers can login and click on the relevant links to access.
- Currencies
- Cryptocurrencies
- Commodities
- Major Benchmarks
- Sub-sectors / Industries
- ETFs: Bonds | Commodities | Equity Markets | Industries | Sectors
Subscribe now.
Sentiment on Monday, as gauged by the put-call ratio, ended bearish at 1.04.
Seasonal charts of companies reporting earnings today:
S&P 500 Index
TSE Composite
| Sponsored By... |

|


