Stock Market Outlook for September 15, 2023

The weakest, most volatile, time of the year for stocks is directly ahead.
*** Stocks highlighted are for information purposes only and should not be considered as advice to purchase or to sell mentioned securities. As always, the use of technical and fundamental analysis is encouraged in order to fine tune entry and exit points to average seasonal trends.
Stocks Entering Period of Seasonal Strength Today:
Subscribers Click on the relevant link to view the full profile. Not a subscriber? Signup here.

Employers Holdings Inc. (NYSE:EIG) Seasonal Chart

iShares Morningstar Large-Cap Value ETF (NYSE:ILCV) Seasonal Chart

Vanguard S&P Small-Cap 600 ETF (NYSE:VIOO) Seasonal Chart
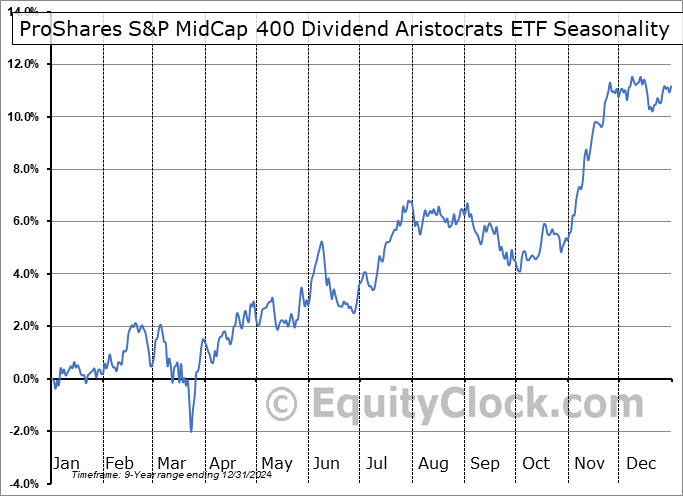
ProShares S&P MidCap 400 Dividend Aristocrats ETF (NYSE:REGL) Seasonal Chart

iShares Global Water Index ETF (TSE:CWW.TO) Seasonal Chart

Automatic Data Processing, Inc. (NASD:ADP) Seasonal Chart

Oil Dri Corp. Of America (NYSE:ODC) Seasonal Chart

Safety Insurance Group, Inc. (NASD:SAFT) Seasonal Chart

Autozone Inc. Nevada (NYSE:AZO) Seasonal Chart
The Markets
Stocks rallied on Thursday following the release of a slate of strong economic reports that poured cold water on the prospect of the economy falling into an imminent recession. The S&P 500 Index closed the day higher by just over eight-tenths of one percent, bouncing from its 20-day moving average that is acting as a level of short-term support. Momentum indicators continue to sit around their middle lines and MACD is still threatening to converge negatively on its signal line, at risk of adopting characteristics of a bearish trend. Heading into the weakest time of year in the back half of September, the large-cap benchmark is lagging the slightly upbeat performance that is normal month-to-date, but our caution is squarely focused on the timeframe ahead given the history of very poor results to end off the third quarter.

Today, in our Market Outlook to subscribers, we discuss the following:
- Weakest time of the year for stocks
- Some of the more defensive segments of the market bouncing from significant horizontal support
- US Retail Sales
- Business/Retail Inventories
- Weekly Jobless Claims and the health of the labor market
Subscribers can look for this report in their inbox or by clicking on the following link and logging in: Market Outlook for September 15
Not signed up yet? Subscribe now to receive full access to all of the research and analysis that we publish.
Sentiment on Thursday, as gauged by the put-call ratio, ended bearish at 1.07.

Seasonal charts of companies reporting earnings today:

S&P 500 Index


TSE Composite


| Sponsored By... |

|


