Stock Market Outlook for September 26, 2023

Not one sector of the market has made meaningful upside progress in the past seven quarters and this is telling us something.
*** Stocks highlighted are for information purposes only and should not be considered as advice to purchase or to sell mentioned securities. As always, the use of technical and fundamental analysis is encouraged in order to fine tune entry and exit points to average seasonal trends.
Stocks Entering Period of Seasonal Strength Today:
Subscribers Click on the relevant link to view the full profile. Not a subscriber? Signup here.

UBS AG (NYSE:UBS) Seasonal Chart

Invesco Dynamic Large Cap Value ETF (NYSE:PWV) Seasonal Chart

SPDR S&P China ETF (NYSE:GXC) Seasonal Chart

iShares China Large-Cap ETF (NYSE:FXI) Seasonal Chart

Global X China Financials ETF (NYSE:CHIX) Seasonal Chart

iShares Global Agriculture Index ETF (TSE:COW.TO) Seasonal Chart

SNC-Lavalin Group, Inc. (TSE:SNC.TO) Seasonal Chart

Voya Financial, Inc. (NYSE:VOYA) Seasonal Chart

Hollysys Automation Technologies, Ltd. (NASD:HOLI) Seasonal Chart

XPO Logistics, Inc. (NYSE:XPO) Seasonal Chart

AAR Corp. (NYSE:AIR) Seasonal Chart
The Markets
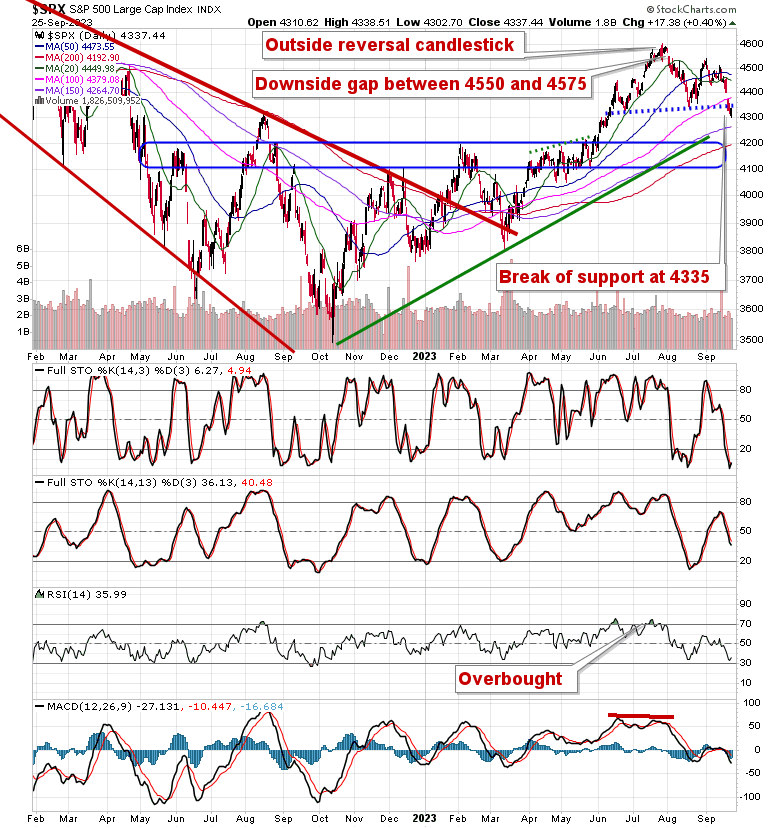
Stocks closed mildly higher on Monday as investors try to shake off concerns related to the ongoing rise of interest rates that triggered the sharp selloff in equity markets last week. The S&P 500 Index punched out a gain of four-tenths of one percent, closing back at previous short-term support at 4335 that was broken last week. The 50-day moving average has joined the 20-day curling lower, both providing points of resistance overhead as the market seeks to close out the weakest/most volatile time of the year during the back half of September. Momentum indicators are showing slight signs of stabilization following Monday’s reprieve in selling pressures, but characteristics of a bearish trend remain as they adopt positions below their middle lines. Levels down to previous horizontal resistance at 4200 remains fair game in order to mitigate any significant damage prior to the start of the best six months of the year for stocks; below this threshold, we have to consider longer-term negative implications, quite possibly coinciding with a recessionary downturn in the market.
Today, in our Market Outlook to subscribers, we discuss the following:
- The ongoing rise of treasury yields and the break of significant support for the intermediate treasury bond ETF
- Our weekly chart books update: Find out which changes we have made to our Accumulate/Avoid list
- Sectors stuck below significant horizontal resistance presented by the 2022 highs
- Industrial sector
- Banks
Subscribers can look for this report in their inbox or by clicking on the following link and logging in: Market Outlook for September 26
Not signed up yet? Subscribe now to receive full access to all of the research and analysis that we publish.
Want to know which areas of the market to buy or sell? Our Weekly Chart Books have just been updated, providing a clear Accumulate, Avoid, or Neutral rating for currencies, cryptocurrencies, commodities, broad markets, and subsectors/industries of the market. Subscribers can login and click on the relevant links to access.
- Currencies
- Cryptocurrencies
- Commodities
- Major Benchmarks
- Sub-sectors / Industries
- ETFs: Bonds | Commodities | Equity Markets | Industries | Sectors
Subscribe now.
Sentiment on Monday, as gauged by the put-call ratio, ended bearish at 1.04.

Seasonal charts of companies reporting earnings today:


S&P 500 Index


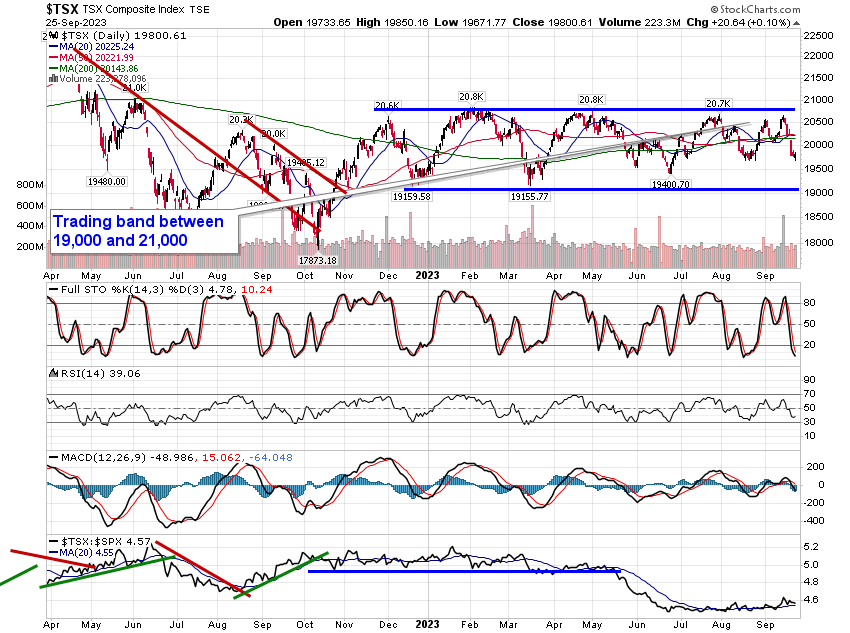
TSE Composite

| Sponsored By... |

|


