Stock Market Outlook for October 3, 2023

Low volatility ETFs certainly not providing the refuge to mitigate the normal volatility at this time of year.
*** Stocks highlighted are for information purposes only and should not be considered as advice to purchase or to sell mentioned securities. As always, the use of technical and fundamental analysis is encouraged in order to fine tune entry and exit points to average seasonal trends.
Stocks Entering Period of Seasonal Strength Today:
Subscribers Click on the relevant link to view the full profile. Not a subscriber? Signup here.

Invesco Dynamic Energy Exploration & Production ETF (NYSE:PXE) Seasonal Chart
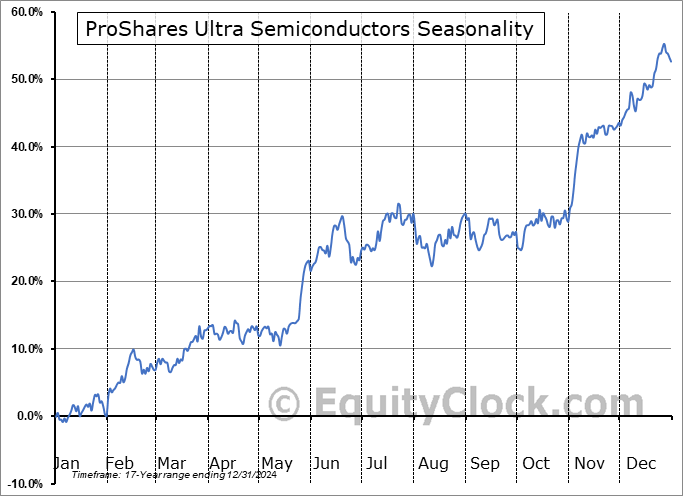
ProShares Ultra Semiconductors (NYSE:USD) Seasonal Chart

ITT Inc. (NYSE:ITT) Seasonal Chart

Cameco Corp. (NYSE:CCJ) Seasonal Chart

Ceva Inc. (NASD:CEVA) Seasonal Chart

EMCOR Group, Inc. (NYSE:EME) Seasonal Chart

State Street Corp. (NYSE:STT) Seasonal Chart
The Markets
Stocks closed mixed on Monday as the market continues to battle the headwinds of rising rates and a strengthening US Dollar. The S&P 500 Index closed essentially unchanged, continuing to hold the short-term low that was charted last week just above significant horizontal support at 4200. Near-term downside momentum continues to wane as the MACD histogram narrows back towards zero. Even with all of the headwinds against it, this market is doing a valiant job of maintaining the limits of what can be considered to be a healthy correction through August and September and rising trendline support stemming from last October’s low has yet to be violated. A head-and-shoulders topping pattern remains a threat overhead with levels of resistance still implied around the declining 20 and 50-day moving averages at 4397 and 4447, respectively. Between here and the level of resistance overhead, the near-term risk-reward appears favourable while monitoring how the market reacts to the significant band of support between 4100 and 4200. Any alleviation of the rate and dollar headwinds in the weeks ahead would be welcomed.

Today, in our Market Outlook to subscribers, we discuss the following:
- Shocking declines in rate sensitive segments
- Investors showing no desire to hold defensive positions
- Cryptocurrency market not expressing risk aversion
- Our weekly chart books update: Find our which groups have been added to our list of market segments to Accumulate and to Avoid
Subscribers can look for this report in their inbox or by clicking on the following link and logging in: Market Outlook for October 3
Not signed up yet? Subscribe now to receive full access to all of the research and analysis that we publish.
Want to know which areas of the market to buy or sell? Our Weekly Chart Books have just been updated, providing a clear Accumulate, Avoid, or Neutral rating for currencies, cryptocurrencies, commodities, broad markets, and subsectors/industries of the market. Subscribers can login and click on the relevant links to access.
- Currencies
- Cryptocurrencies
- Commodities
- Major Benchmarks
- Sub-sectors / Industries
- ETFs: Bonds | Commodities | Equity Markets | Industries | Sectors
Subscribe now.
Sentiment on Monday, as gauged by the put-call ratio, ended bearish at 1.12.

Seasonal charts of companies reporting earnings today:


S&P 500 Index


TSE Composite


| Sponsored By... |

|


