Stock Market Outlook for October 4, 2023

Rising rates will remain a headwind against stocks until the market comes to a consensus that the economy is slowing.
*** Stocks highlighted are for information purposes only and should not be considered as advice to purchase or to sell mentioned securities. As always, the use of technical and fundamental analysis is encouraged in order to fine tune entry and exit points to average seasonal trends.
Stocks Entering Period of Seasonal Strength Today:
Subscribers Click on the relevant link to view the full profile. Not a subscriber? Signup here.

WisdomTree Global ex-U.S. Quality Dividend Growth Fund (NYSE:DNL) Seasonal Chart

Sprott Physical Uranium Trust (TSE:U/UN.TO) Seasonal Chart

Moneta Gold Inc. (TSE:ME.TO) Seasonal Chart

VanEck Vectors Semiconductor ETF (NASD:SMH) Seasonal Chart

Danaher Corp. (NYSE:DHR) Seasonal Chart

Globus Medical, Inc. (NYSE:GMED) Seasonal Chart

Cathedral Energy Services Ltd. (TSE:CET.TO) Seasonal Chart

Seagate Technology Holdings, Inc. (NASD:STX) Seasonal Chart

Chorus Aviation, Inc. (TSE:CHR.TO) Seasonal Chart

Southern Copper Corp. (NYSE:SCCO) Seasonal Chart
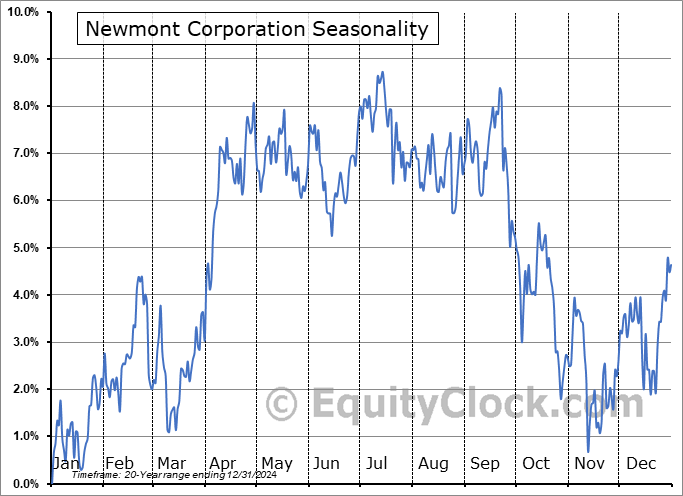
Newmont Corporation (NYSE:NEM) Seasonal Chart
The Markets
Stocks took a leg lower on Tuesday as the cost of borrowing continues its recent parabolic rise, in part due to the turmoil that is taking place in Congress and the recent strength of employment data in the US. The S&P 500 Index fell by 1.37%, breaking rising trendline support that stems from the October low and reaching back towards the band of support between 4100 and 4200. The Relative Strength Index (RSI) has crossed into oversold territory for the first time since September of last year. The oversold condition around a band of significant support is still viewed as skewing the near-term risk-reward to favour a short-term rebound following normal August and September weakness, but the sustainability of any reprieve in the declining trajectory remains questionable with the ongoing trend higher in rates and the US dollar. Rates and the dollar are vastly overbought, while stocks are oversold, setting the stage to exhaust the near-term prevailing trends. A definitive break of the the significant band of support below would certainly alter the near-term positive risk-reward bias. Heading into earnings season that gets underway next week, it will be very difficult to sustain negative momentum during this timeframe when investors tend to want to hold a neutral bias surrounding the release of the results. Prices during this period will often become pinned to levels around 20 and 50-day moving averages, which currently sit overhead at 4384 and 4441, respectively. How the market reacts to the band of support below and the levels of resistance at major moving averages will be key to the path of stocks heading towards the start of the best six months of the year timeframe that gets underway around month-end.

Today, in our Market Outlook to subscribers, we discuss the following:
- Difficult to be sustainably bullish of stocks while rates are on the rise
- Yield curve undergoing a bear-steepener
- Job Openings and Labor Turnover Survey (JOLTS)
- US Construction Spending and the pair trade that makes a lot of sense to take advantage of the macro-fundamental trajectory
- Our list of segments of the market to either Accumulate or Avoid
Subscribers can look for this report in their inbox or by clicking on the following link and logging in: Market Outlook for October 4
Not signed up yet? Subscribe now to receive full access to all of the research and analysis that we publish.
Sentiment on Tuesday, as gauged by the put-call ratio, ended bearish at 1.14.

Seasonal charts of companies reporting earnings today:


S&P 500 Index


TSE Composite


| Sponsored By... |

|


