Stock Market Outlook for October 17, 2023

The US Dollar Index is charting a near-term peak, conducive to the recent stability in equity prices.
*** Stocks highlighted are for information purposes only and should not be considered as advice to purchase or to sell mentioned securities. As always, the use of technical and fundamental analysis is encouraged in order to fine tune entry and exit points to average seasonal trends.
Stocks Entering Period of Seasonal Strength Today:
Subscribers Click on the relevant link to view the full profile. Not a subscriber? Signup here.

Customers Bancorp, Inc. (NYSE:CUBI) Seasonal Chart

Accord Financial Corp. (TSE:ACD.TO) Seasonal Chart
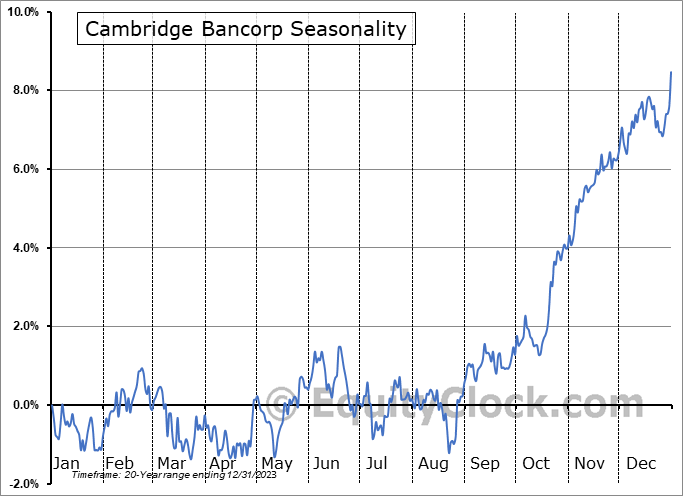
Cambridge Bancorp (NASD:CATC) Seasonal Chart

Cleveland-Cliffs Inc (NYSE:CLF) Seasonal Chart

Heron Therapeutics, Inc. (NASD:HRTX) Seasonal Chart

BMO Equal Weight U.S. Banks Hedged to CAD Index ETF (TSE:ZUB.TO) Seasonal Chart

Steel Dynamics, Inc. (NASD:STLD) Seasonal Chart

Commerce Bancshares, Inc. (NASD:CBSH) Seasonal Chart

Stantec, Inc. (TSE:STN.TO) Seasonal Chart

Teradyne, Inc. (NASD:TER) Seasonal Chart

PNC Financial Services Gr (NYSE:PNC) Seasonal Chart

Perkinelmer, Inc. (NYSE:PKI) Seasonal Chart
The Markets
Stocks closed firmly higher to start the week as the market attempts to find comfort in the apparent near-term peak in interest rates and the US Dollar. The S&P 500 Index closed with a gain of over one percent, holding between two major moving averages at the 20 and 50-day. The shorter of the averages (the 20-day) is showing evidence of starting to support the near-term path of the benchmark, while the 50-day moving average at 4400 remains a formidable threat overhead. The intermediate variable hurdle also aligns with the downside gap that was charted in the back half of September, giving investors plenty to react to as they scrutinize the sustainability of what can at least be considered to be an oversold bounce in stocks. The short-term path stemming from the July highs remains that of lower-lows and lower-highs, but the intermediate-term risk-reward of the benchmark remains enticing so long as the band of support between 4100 and 4200 is maintained.

Today, in our Market Outlook to subscribers, we discuss the following:
- Evidence of a peak in the US Dollar Index
- Our weekly chart books update along with our list of market segments to Accumulate and to Avoid
- Empire State Manufacturing Index
- Copper
Subscribers can look for this report in their inbox or by clicking on the following link and logging in: Market Outlook for October 17
Not signed up yet? Subscribe now to receive full access to all of the research and analysis that we publish.
Want to know which areas of the market to buy or sell? Our Weekly Chart Books have just been updated, providing a clear Accumulate, Avoid, or Neutral rating for currencies, cryptocurrencies, commodities, broad markets, and subsectors/industries of the market. Subscribers can login and click on the relevant links to access.
- Currencies
- Cryptocurrencies
- Commodities
- Major Benchmarks
- Sub-sectors / Industries
- ETFs: Bonds | Commodities | Equity Markets | Industries | Sectors
Subscribe now.
Sentiment on Monday, as gauged by the put-call ratio, ended bearish at 1.10.

Seasonal charts of companies reporting earnings today:


 Seasonal Chart")


S&P 500 Index


TSE Composite


| Sponsored By... |

|


