Stock Market Outlook for October 19, 2023

It is difficult to become reasonably assured that a sustainable rally in stocks is ahead during the best six months of the year for the market while interest rates remain on the rise.
*** Stocks highlighted are for information purposes only and should not be considered as advice to purchase or to sell mentioned securities. As always, the use of technical and fundamental analysis is encouraged in order to fine tune entry and exit points to average seasonal trends.
Stocks Entering Period of Seasonal Strength Today:
Subscribers Click on the relevant link to view the full profile. Not a subscriber? Signup here.

Ford Motor Co. (NYSE:F) Seasonal Chart

Marriott International, Inc. (NASD:MAR) Seasonal Chart
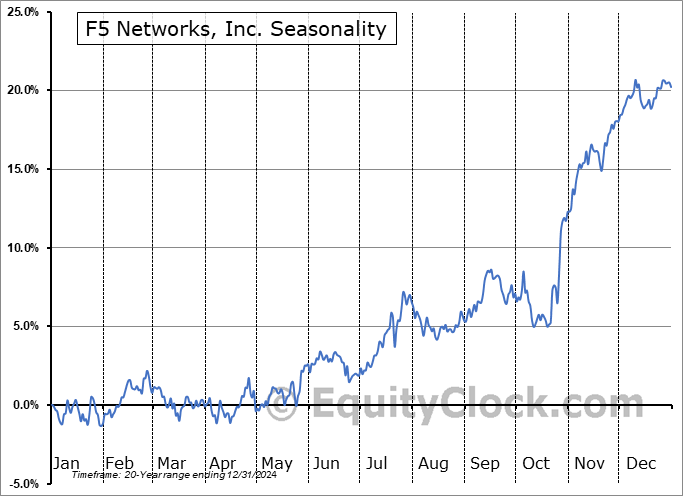
F5 Networks, Inc. (NASD:FFIV) Seasonal Chart

Arrow Electronics Inc. (NYSE:ARW) Seasonal Chart

Motorcar Parts of America Inc. (NASD:MPAA) Seasonal Chart

UFP Industries (NASD:UFPI) Seasonal Chart

Coty Inc. (NYSE:COTY) Seasonal Chart

Merchants Bancorp (NASD:MBIN) Seasonal Chart
The Markets
Stocks tumbled on Wednesday as a new multi-year high in interest rates had investors pulling back. The S&P 500 Index closed with a loss of 1.34%, continuing to feel the rejection from resistance at the declining 50-day moving average close to 4400. The intermediate moving average is working to keep the short-term trend of lower-lows and lower-highs stemming from the July peak intact as we navigate closer to the strongest time of the year for the stock market ahead. The benchmark closed almost precisely at implied short-term support at the 20-day moving average of 4314, but the more significant hurdle to scrutinize remains the band of support between 4100 and 4200. While the intermediate-term risk-reward remains favourable so long as the band of support remains intact, we may have to accept a sluggish trading environment in the near-term while investors digest the earnings reports and gauge the direction of yields.

Today, in our Market Outlook to subscribers, we discuss the following:
- New multi-year high in the cost of borrowing
- US Housing Starts and the sentiment of builders
- Canada Consumer Price Index (CPI)
- US Petroleum Status and how to play the abnormal autumn strength in the price of Oil
Subscribers can look for this report in their inbox or by clicking on the following link and logging in: Market Outlook for October 19
Not signed up yet? Subscribe now to receive full access to all of the research and analysis that we publish.
Sentiment on Wednesday, as gauged by the put-call ratio, ended close to neutral at 1.01.

Seasonal charts of companies reporting earnings today:


 Limited Seasonal Chart")


S&P 500 Index


TSE Composite


| Sponsored By... |

|


