Stock Market Outlook for October 20, 2023

Manufacturers remain highly pessimistic navigating through the fourth quarter and this expresses risks to seasonal strength in core-cyclical assets this fall.
*** Stocks highlighted are for information purposes only and should not be considered as advice to purchase or to sell mentioned securities. As always, the use of technical and fundamental analysis is encouraged in order to fine tune entry and exit points to average seasonal trends.
Stocks Entering Period of Seasonal Strength Today:
Subscribers Click on the relevant link to view the full profile. Not a subscriber? Signup here.

Heico Corp. (NYSE:HEI/A) Seasonal Chart

iShares Morningstar Mid-Cap Growth ETF (NYSE:IMCG) Seasonal Chart

Trane Technologies Inc (NYSE:TT) Seasonal Chart

Invesco S&P SmallCap Information Technology ETF (NASD:PSCT) Seasonal Chart

iShares U.S. Aerospace & Defense ETF (NYSE:ITA) Seasonal Chart

Miller Industries Inc Tn (NYSE:MLR) Seasonal Chart

Autoliv, Inc. (NYSE:ALV) Seasonal Chart

Carlisle Cos, Inc. (NYSE:CSL) Seasonal Chart
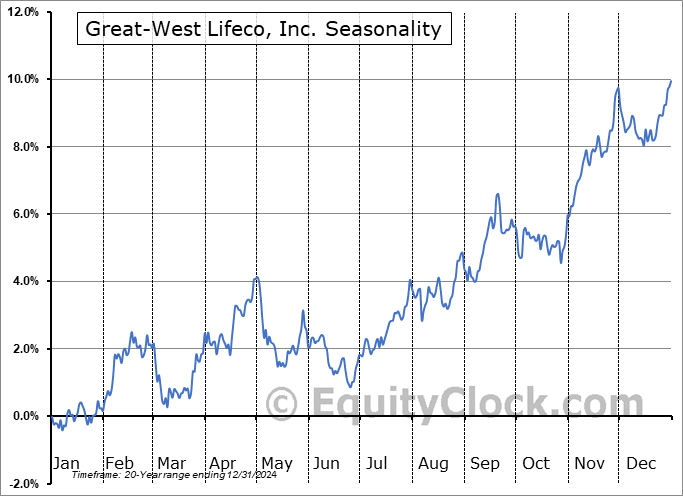
Great-West Lifeco, Inc. (TSE:GWO.TO) Seasonal Chart

Microchip Technology Inc. (NASD:MCHP) Seasonal Chart

Honeywell International, Inc. (NASD:HON) Seasonal Chart

PC Connection, Inc. (NASD:CNXN) Seasonal Chart

Science Applications International Corp. (NYSE:SAIC) Seasonal Chart

Invesco Dynamic Semiconductors ETF (NYSE:PSI) Seasonal Chart

West Fraser Timber Co., Ltd. (NYSE:WFG) Seasonal Chart

Fastenal Co. (NASD:FAST) Seasonal Chart

Energy Fuels, Inc. (TSE:EFR.TO) Seasonal Chart

Buckle, Inc. (NYSE:BKE) Seasonal Chart

Boeing Co. (NYSE:BA) Seasonal Chart

MercadoLibre Inc. (NASD:MELI) Seasonal Chart

Manitowoc Co, Inc. (NYSE:MTW) Seasonal Chart
The Markets
Stocks continued to weaken on Thursday as investors remain focused on the rising path of interest rates. The S&P 500 Index closed lower by over eight-tenths of one percent, moving below implied short-term support at the 20-day moving average. Resistance at the 50-day moving average around 4400 has proven to be a formidable cap as the benchmark reaches back to significant horizontal support at 4200. The short-term trend of lower-lows and lower-highs stemming from the July peak persists. The risk-reward to stocks still appears enticing at the horizontal band below, but the lack of resilience of the bulls at the 20-day moving average obviously opens up the threat to a more significant breakdown ahead. The best six months of the year trend for stocks begins on October 28th, on average, and, between now and then, it may be prudent to limit risk in portfolios until greater clarity pertaining to the strength of support behind this market is achieved. The status quo remains: strength in interest rates bodes poorly for stocks. We need to either see the cost of borrowing peak or the pattern to break, although the latter scenario has the prospect of coinciding with a broad economic recession.

Today, in our Market Outlook to subscribers, we discuss the following:
- The VIX
- Net Assets held by the Fed
- US Existing Home Sales
- Weekly Jobless Claims and the health of the labor market
- Manufacturer Sentiment
Subscribers can look for this report in their inbox or by clicking on the following link and logging in: Market Outlook for October 20
Not signed up yet? Subscribe now to receive full access to all of the research and analysis that we publish.
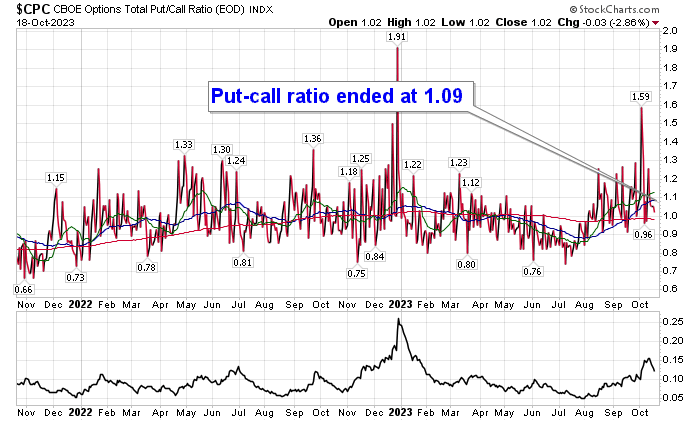
Sentiment on Thursday, as gauged by the put-call ratio, ended bearish at 1.09.
Seasonal charts of companies reporting earnings today:


 Seasonal Chart")


S&P 500 Index


TSE Composite


| Sponsored By... |

|


