Stock Market Outlook for October 23, 2023

Looking at a number of the coincident signals of economic activity, a recession does not seem like an imminent or obvious threat.
*** Stocks highlighted are for information purposes only and should not be considered as advice to purchase or to sell mentioned securities. As always, the use of technical and fundamental analysis is encouraged in order to fine tune entry and exit points to average seasonal trends.
Stocks Entering Period of Seasonal Strength Today:
Subscribers Click on the relevant link to view the full profile. Not a subscriber? Signup here.
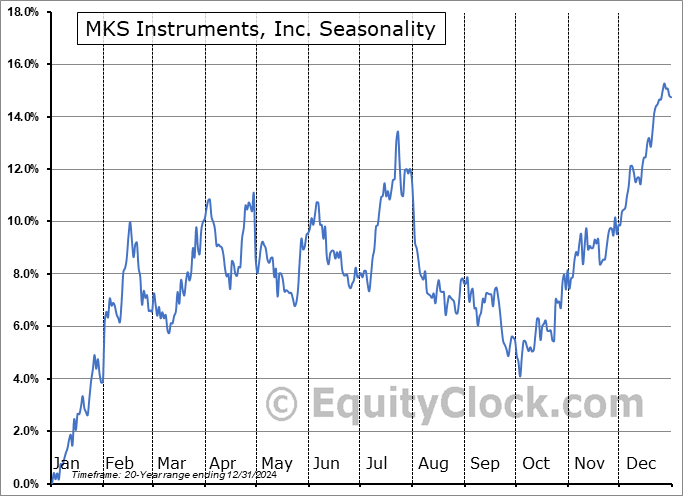
MKS Instruments, Inc. (NASD:MKSI) Seasonal Chart

Wheaton Precious Metals Corp. (TSE:WPM.TO) Seasonal Chart

SPDR S&P Semiconductor ETF (NYSE:XSD) Seasonal Chart

Vanguard Materials ETF (NYSE:VAW) Seasonal Chart

Moelis & Co. (NYSE:MC) Seasonal Chart

Johnson Controls Intl plc (NYSE:JCI) Seasonal Chart

St Joe Corp. (NYSE:JOE) Seasonal Chart

Reliance Steel & Aluminum (NYSE:RS) Seasonal Chart

PacWest Bancorp (NASD:PACW) Seasonal Chart

Knight-Swift Transportation Holdings Inc. (NYSE:KNX) Seasonal Chart

Monster Beverage Corp. (NASD:MNST) Seasonal Chart

Open Text Corp. (TSE:OTEX.TO) Seasonal Chart

Fairfax Financial Holdings Ltd. (TSE:FFH.TO) Seasonal Chart

Charles Schwab Corp. (NYSE:SCHW) Seasonal Chart
The Markets
Stocks closed lower on Friday as investor continue to monitor the rising path of treasury yields and ongoing geopolitical uncertainties. The S&P 500 Index shed 1.26%, inching closer to the band of significant horizontal support between 4100 and 4200. Resistance at the declining 50-day moving average continues to hold firm as the benchmark intersects with the 200-day moving average for the first time since March. While the horizontal band of support holds a higher degree of significance than the 200-day, history tells us that nothing good happens in the market when price is below this long-term hurdle. The benchmark remains in this short-term declining trend of lower-highs and lower-lows, capped by the 50-day moving average, and we are watching closely how resilient this market is around the levels of significance below. Core cyclical sectors of the market, encompassing a number of sectors/industries that have been on our Avoid list for some time, are responsible for the recent market weakness, highlighting diminished risk sentiment as investors seemingly prepare for a tougher backdrop for stocks and the economy ahead.

Today, in our Market Outlook to subscribers, we discuss the following:
- Weekly look at the large-cap benchmark
- Intersection of the 10-Year Treasury Note with the psychologically important 5% level
- Bear-steepener of the yield curve
- Macro-economic data not yet indicative of an imminent recession
- Average performance of stocks and gold during recessionary years
- Active investment manager exposure to stocks
- Canadian Retail Sales
Subscribers can look for this report in their inbox or by clicking on the following link and logging in: Market Outlook for October 23
Not signed up yet? Subscribe now to receive full access to all of the research and analysis that we publish.
Sentiment on Friday, as gauged by the put-call ratio, ended bearish at 1.08.

Seasonal charts of companies reporting earnings today:


 Seasonal Chart")
S&P 500 Index


TSE Composite


| Sponsored By... |

|


