Stock Market Outlook for October 24, 2023

Commodity prices showing a strengthening trend, but can the asset class overcome the seasonal headwinds that are normal over the next month and a half?
*** Stocks highlighted are for information purposes only and should not be considered as advice to purchase or to sell mentioned securities. As always, the use of technical and fundamental analysis is encouraged in order to fine tune entry and exit points to average seasonal trends.
Stocks Entering Period of Seasonal Strength Today:
Subscribers Click on the relevant link to view the full profile. Not a subscriber? Signup here.
iShares Semiconductor ETF (NASD:SOXX) Seasonal Chart
iShares Edge MSCI Intl Value Factor ETF (AMEX:IVLU) Seasonal Chart
SPDR S&P 500 Value ETF (NYSE:SPYV) Seasonal Chart
Bristol Myers Squibb Co. (NYSE:BMY) Seasonal Chart
Enanta Pharmaceuticals, Inc. (NASD:ENTA) Seasonal Chart
FS Bancorp, Inc. (NASD:FSBW) Seasonal Chart
Bankunited Inc. (NYSE:BKU) Seasonal Chart
Cogeco, Inc. (TSE:CGO.TO) Seasonal Chart
Telefonica Brasil SA (NYSE:VIV) Seasonal Chart
Benchmark Electronics Inc. (NYSE:BHE) Seasonal Chart
United Therapeutics Corp. (NASD:UTHR) Seasonal Chart
Dillards Inc (NYSE:DDS) Seasonal Chart
The Markets
Stocks struggled to hold onto gains on Monday, despite a reprieve in the rise of interest rates following comments from recent bond bear Bill Ackman, who noted that he covered his shorts against the asset class. The S&P 500 Index closed down by two-tenths of one percent, ending for a second day below the important 200-day moving average. The horizontal band of support between 4100 and 4200 remains intact below, but a battle is playing out for market control between the bullish and bearish camps. The short-term trend remains that of lower-highs and lower-lows, remaining a threat heading into the band of support and as the market enters the best six months of the year performance. Scrutiny of the 4200 hurdle remains warranted; below this level the argument of favourable risk-reward heading into the end of the year shifts more in favour of the bears.
Today, in our Market Outlook to subscribers, we discuss the following:
- Momentum divergences in treasury yields and bond prices
- Our weekly chart books update along with our list of market segments to Accumulate and to Avoid
- The action we are taking in the Super Simple Seasonal Portfolio
- Bitcoin
Subscribers can look for this report in their inbox or by clicking on the following link and logging in: Market Outlook for October 24
Not signed up yet? Subscribe now to receive full access to all of the research and analysis that we publish.
Want to know which areas of the market to buy or sell? Our Weekly Chart Books have just been updated, providing a clear Accumulate, Avoid, or Neutral rating for currencies, cryptocurrencies, commodities, broad markets, and subsectors/industries of the market. Subscribers can login and click on the relevant links to access.
- Currencies
- Cryptocurrencies
- Commodities
- Major Benchmarks
- Sub-sectors / Industries
- ETFs: Bonds | Commodities | Equity Markets | Industries | Sectors
Subscribe now.
Sentiment on Monday, as gauged by the put-call ratio, ended slightly bullish at 0.92.
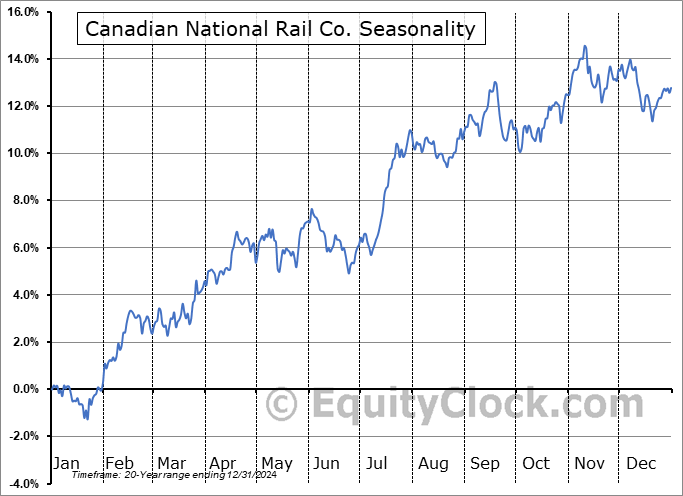
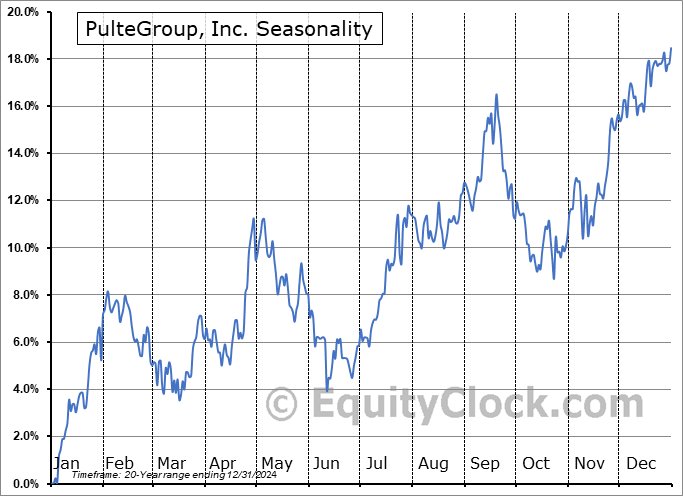
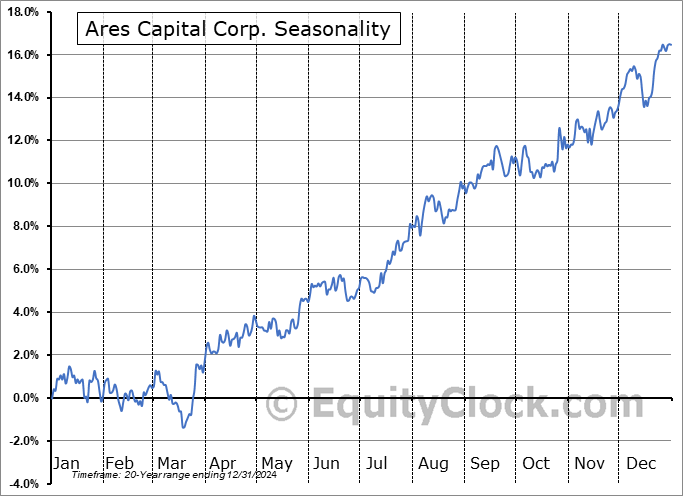
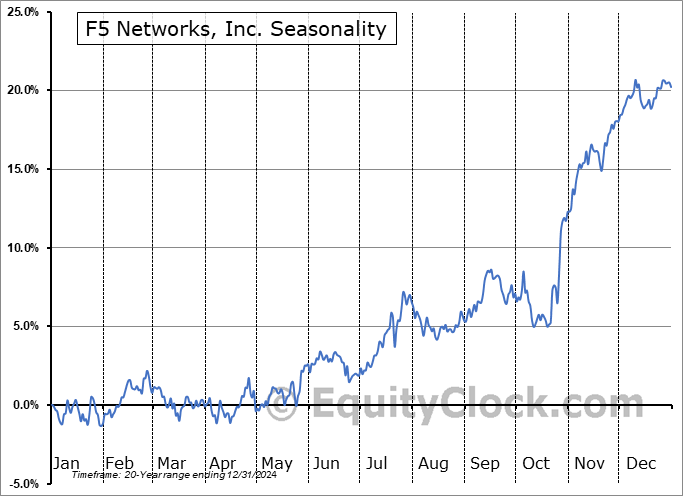
Seasonal charts of companies reporting earnings today:
S&P 500 Index
TSE Composite
| Sponsored By... |

|


