Stock Market Outlook for October 26, 2023

The cost of borrowing has become hinged in recent days to the gyrations in the price of oil.
*** Stocks highlighted are for information purposes only and should not be considered as advice to purchase or to sell mentioned securities. As always, the use of technical and fundamental analysis is encouraged in order to fine tune entry and exit points to average seasonal trends.
Stocks Entering Period of Seasonal Strength Today:
Subscribers Click on the relevant link to view the full profile. Not a subscriber? Signup here.

Old Dominion Freight Line, Inc. (NASD:ODFL) Seasonal Chart

Astec Industries, Inc. (NASD:ASTE) Seasonal Chart

Middleby Corp. (NASD:MIDD) Seasonal Chart

Amcor plc (NYSE:AMCR) Seasonal Chart

iShares North American Tech-Multimedia Networking ETF (NYSE:IGN) Seasonal Chart
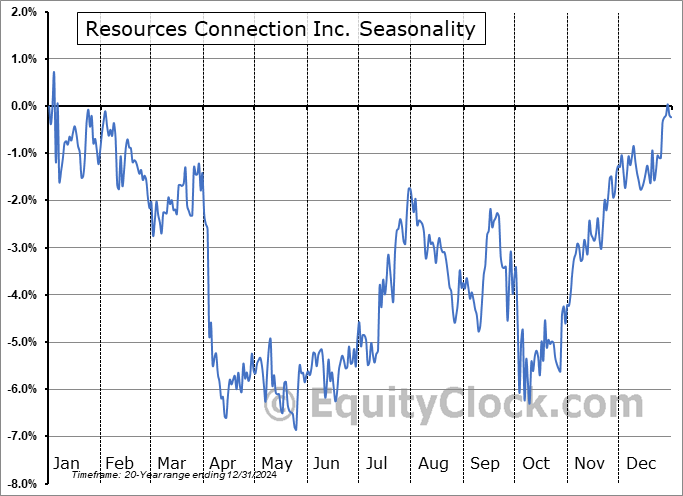
Resources Connection Inc. (NASD:RGP) Seasonal Chart
The Markets
Stocks faltered on Wednesday amidst a poor reaction to earnings from Alphabet (Google), along with a re-flaring of the cost of borrowing and the price of oil. The S&P 500 Index ended down by 1.43%, closing within the significant band of horizontal support between 4100 and 4200. While the aforementioned range remains the key hurdle to scrutinize, further declines below the 200-day moving average is enough to raise a bit of concern heading into the strongest time of year for stocks that gets underway at the end of this week. There is a saying that “nothing good happens while price is below the long-term average” given the number of occurrences of sharp daily declines while below the hurdle, therefore this has to be contemplated as a risk as the market gets set to enter the period of seasonal strength ahead. The short-term trend remains that of lower-highs and lower-lows stemming from the July peak and momentum indicators continue to hold positions below their middle lines, characteristic of a bearish trend. While the risk-reward for stocks still appears favourable for the seasonally strong timeframe ahead, against the band of support that is now being tested, we have to acknowledge the incremental increase in risk that has developed, threatening the prospects of a year-end rally. The lack of fear back above the 21 hurdle on the VIX (by Wednesday’s close) still keeps the prospect that we have realized a buy signal according to our simplistic 12-21 strategy, as highlighted in our previous report.

Today, in our Market Outlook to subscribers, we discuss the following:
- Evidence of risk aversion in the market
- US New Home Sales, the stocks of the home builders, Lumber, and the stocks of forestry companies
- Weekly Petroleum Status and the trends in the energy sector
- The correlation that the cost of borrowing (yields) has shown towards the gyrations in the oil market
- The trend of respiratory illnesses heading into the holiday season
Subscribers can look for this report in their inbox or by clicking on the following link and logging in: Market Outlook for October 26
Not signed up yet? Subscribe now to receive full access to all of the research and analysis that we publish.
Sentiment on Wednesday, as gauged by the put-call ratio, ended bearish at 1.28.

Seasonal charts of companies reporting earnings today:


 Seasonal Chart")


 Seasonal Chart")


 Seasonal Chart")


S&P 500 Index


TSE Composite


| Sponsored By... |

|


