Stock Market Outlook for October 27, 2023

Today marks the average start to the best six months of the year for stocks. Over the past five decades, the S&P 500 Index has gained an average of 8.12% between October 27th and May 5th.
*** Stocks highlighted are for information purposes only and should not be considered as advice to purchase or to sell mentioned securities. As always, the use of technical and fundamental analysis is encouraged in order to fine tune entry and exit points to average seasonal trends.
Stocks Entering Period of Seasonal Strength Today:
Subscribers Click on the relevant link to view the full profile. Not a subscriber? Signup here.

SPDR Portfolio S&P 600 Small Cap ETF (AMEX:SPSM) Seasonal Chart

Ocular Therapeutix Inc. (NASD:OCUL) Seasonal Chart

Central and Eastern Europe Fund, Inc. (NYSE:CEE) Seasonal Chart

Schwab Fundamental U.S. Small Company Index ETF (AMEX:FNDA) Seasonal Chart

iShares U.S. Healthcare Providers ETF (NYSE:IHF) Seasonal Chart

Vanguard S&P Mid-Cap 400 ETF (NYSE:IVOO) Seasonal Chart

iShares Russell 2000 Growth ETF (NYSE:IWO) Seasonal Chart

Invesco Aerospace & Defense ETF (NYSE:PPA) Seasonal Chart

Invesco Dynamic Networking ETF (NYSE:PXQ) Seasonal Chart

Invesco S&P 500 High Beta ETF (NYSE:SPHB) Seasonal Chart

Eaton Corp. (NYSE:ETN) Seasonal Chart

Nucor Corp. (NYSE:NUE) Seasonal Chart

Textron, Inc. (NYSE:TXT) Seasonal Chart

Manulife Financial Corp. (TSE:MFC.TO) Seasonal Chart
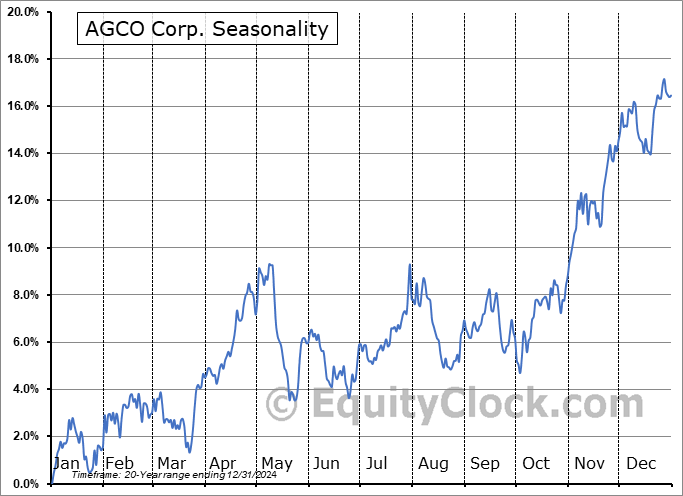
AGCO Corp. (NYSE:AGCO) Seasonal Chart

Boston Scientific Corp. (NYSE:BSX) Seasonal Chart

Mosaic Co. (NYSE:MOS) Seasonal Chart
The Markets
Stocks continued to struggle on Thursday as weakness in technology pulled broad market benchmarks lower. The S&P 500 Index closed with a loss of 1.18%, pushing further into the significant band of support between 4100 and 4200. The short-term trend of lower-lows and lower-highs stemming from the July peak persists, but connecting the lines between the peaks and the troughs of this path shows that the benchmark is testing the lower limit of its prevailing declining span. Both the horizontal band and implied declining trendline resistance present make-or-break points to the intermediate path of the benchmark as we prepare for the start of the best six month of the year timeframe that begins today. The Relative Strength Index (RSI) is back on the verge of oversold territory, providing the setup that could result in downside exhaustion ahead of this favourble timeframe for the market ahead. Investors are seemingly on the lookout for downside capitulation where the bears relinquish control to the bulls, something that there is a good likelihood of occurring in this zone, but we will let the tape tell the story. Heading through the final few days of October and into the first week of November, there is traditionally an upside bias, therefore the bears will have their work cut out for them to continue the recent pace.

Today, in our Market Outlook to subscribers, we discuss the following:
- Non-growth segments of the market holding up amidst the market selloff
- Technology and Communication Services pressuring rising trendline support
- The start of the best six months of the year for stocks and the long list of securities that start their optimal holding period either today or tomorrow
- Weekly Jobless Claims and the health of the labor market
- US Dollar and Treasury Yields pressuring short-term resistance
- US Durable Goods Orders
Subscribers can look for this report in their inbox or by clicking on the following link and logging in: Market Outlook for October 27
Not signed up yet? Subscribe now to receive full access to all of the research and analysis that we publish.
Sentiment on Thursday, as gauged by the put-call ratio, ended bearish at 1.17.

Seasonal charts of companies reporting earnings today:


 Seasonal Chart")


S&P 500 Index


TSE Composite


| Sponsored By... |

|


