Stock Market Outlook for October 30, 2023

Bonds and commodities are showing the first signs of sustained outperformance versus stocks this year, providing a place of refuge in this market selloff.
*** Stocks highlighted are for information purposes only and should not be considered as advice to purchase or to sell mentioned securities. As always, the use of technical and fundamental analysis is encouraged in order to fine tune entry and exit points to average seasonal trends.
Stocks Entering Period of Seasonal Strength Today:
Subscribers Click on the relevant link to view the full profile. Not a subscriber? Signup here.

Canopy Growth Corp. (NYSE:CGC) Seasonal Chart

SPDR S&P Midcap 400 ETF (NYSE:MDY) Seasonal Chart

Invesco Dynamic Leisure and Entertainment ETF (NYSE:PEJ) Seasonal Chart

Beacon Roofing Supply Inc. (NASD:BECN) Seasonal Chart

Fiserv, Inc. (NASD:FISV) Seasonal Chart

Unitedhealth Group, Inc. (NYSE:UNH) Seasonal Chart
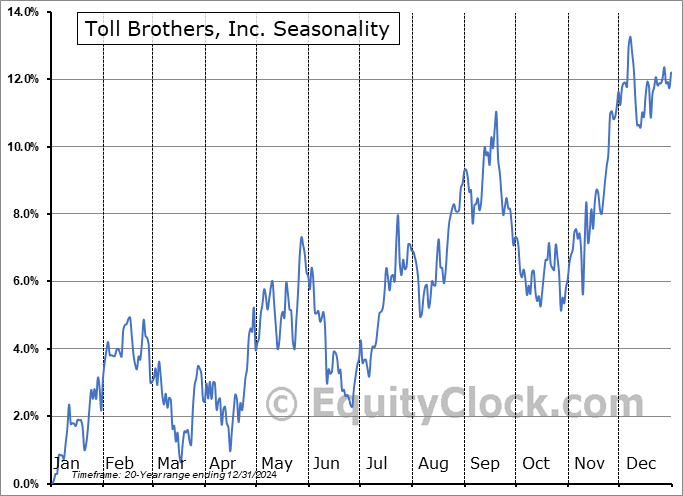
Toll Brothers, Inc. (NYSE:TOL) Seasonal Chart

Cineplex Inc. (TSE:CGX.TO) Seasonal Chart

Becton Dickinson and Co. (NYSE:BDX) Seasonal Chart

Nutrien Ltd. (NYSE:NTR) Seasonal Chart

Vanguard S&P Mid-Cap 400 Value ETF (NYSE:IVOV) Seasonal Chart

CIGNA Corp. (NYSE:CI) Seasonal Chart

Western Digital Corp. (NASD:WDC) Seasonal Chart

Cemex SA (NYSE:CX) Seasonal Chart
The Markets
Stocks continued to struggle into the end of the week as investors express their hesitation of holding elevated levels of risk amidst ongoing geopolitical turmoil. The S&P 500 Index closed lower by just less than half of one percent after touching the lower limit of the band of significant horizontal support between 4100 and 4200. The violation of the lower limit of the declining trend channel that the benchmark has been in since July gives the trajectory a bit of a parabolic look, highlighting the emergence of a disorderly move as the index contends with the horizontal band that is upon us. The Relative Strength Index (RSI) has slipped into oversold territory below 30 for the second time this month, continuing to exhibit characteristics of a bearish trend that has kept traders inclined to remain sellers of stocks. At some point, a reprieve in selling pressures is a reasonable bet coinciding with the start of the best six month of the year trend for the market, but there remains questions as to how sustainable any advance during this favourable timeframe will be. A violation of the current band that is being tested would start to lend itself to a significant lower high below the January of 2022 peak, which would not bode well for the long-term path of the benchmark. Below the aforementioned band, the next logical hurdle to scrutinize is the band of support between 3600 and 3800. The market remains in a highly pivotal position for both the intermediate and long-term paths heading into what is traditionally an upbeat timeframe for the market through the next six months.

Today, in our Market Outlook to subscribers, we discuss the following:
- Weekly look at the large-cap benchmark
- Relative trend of the bond market breaking above a bottoming pattern
- Commodities
- Utilities Sector
- Consumer and Business Loan activity
Subscribers can look for this report in their inbox or by clicking on the following link and logging in: Market Outlook for October 30
Not signed up yet? Subscribe now to receive full access to all of the research and analysis that we publish.
Sentiment on Friday, as gauged by the put-call ratio, ended bearish at 1.18.

Seasonal charts of companies reporting earnings today:


S&P 500 Index


TSE Composite


| Sponsored By... |

|


