Stock Market Outlook for October 31, 2023

Signs of a near-term peak on the US Dollar Index is leading to a rebound of a number of currencies from pivotal points of support.
*** Stocks highlighted are for information purposes only and should not be considered as advice to purchase or to sell mentioned securities. As always, the use of technical and fundamental analysis is encouraged in order to fine tune entry and exit points to average seasonal trends.
Stocks Entering Period of Seasonal Strength Today:
Subscribers Click on the relevant link to view the full profile. Not a subscriber? Signup here.
Principal Value ETF (NASD:PY) Seasonal Chart
Atkore International Group Inc. (NYSE:ATKR) Seasonal Chart
Mid Penn Bancorp (NASD:MPB) Seasonal Chart
Vanguard S&P 500 ETF (NYSE:VOO) Seasonal Chart
iShares Asia 50 ETF (NASD:AIA) Seasonal Chart
Synchrony Financial (NYSE:SYF) Seasonal Chart
Hecla Mining Co. (NYSE:HL) Seasonal Chart
AMN Healthcare Services, Inc. (NYSE:AMN) Seasonal Chart
Alamo Group, Inc. (NYSE:ALG) Seasonal Chart
Century Aluminum Co. (NASD:CENX) Seasonal Chart
Molina Healthcare, Inc. (NYSE:MOH) Seasonal Chart
First Majestic Silver Corp. (TSE:FR.TO) Seasonal Chart
The Markets
Stocks rallied on Monday as the market shook off the extreme pessimism that was recorded through the end of last week and started the best six month of the year timeframe for stocks on a positive note. The S&P 500 Index closed with a gain of 1.20%, recovering from an oversold state according to the Relative Strength Index (RSI) that was observed at the end of last week. Momentum indicators are showing near-term signs of bottoming, which, if achieved, will result in positive momentum divergences with respect to MACD and RSI. The risk-reward to the benchmark remains favourable to accumulate exposure in this band of significant support between 4100 and 4200 and it will take a break below the lower limit to consider changing this view. Resistance remains well defined at the declining 50-day moving average, now around 4350, keeping the short-term trend of lower-lows and lower-highs intact. Uncertainty in the market remains high, as is investor pessimism, but this creates the ideal setup for stocks to stabilize/move higher given that buyers have been exhausted.
Want to know which areas of the market to buy or sell? Our Weekly Chart Books have just been updated, providing a clear Accumulate, Avoid, or Neutral rating for currencies, cryptocurrencies, commodities, broad markets, and subsectors/industries of the market. Subscribers can login and click on the relevant links to access.
- Currencies
- Cryptocurrencies
- Commodities
- Major Benchmarks
- Sub-sectors / Industries
- ETFs: Bonds | Commodities | Equity Markets | Industries | Sectors
Subscribe now.
Today, in our Market Outlook to subscribers, we discuss the following:
- Our weekly chart books update
- The change we are making in the Super Simple Seasonal Portfolio
- Cryptocurrency Solana
- Canadian Dollar and Japanese Yen rebounding from a level of significant support
- Canadian stocks
Subscribers can look for this report in their inbox or by clicking on the following link and logging in: Market Outlook for October 31
Not signed up yet? Subscribe now to receive full access to all of the research and analysis that we publish.
Sentiment on Monday, as gauged by the put-call ratio, ended bearish at 1.09.
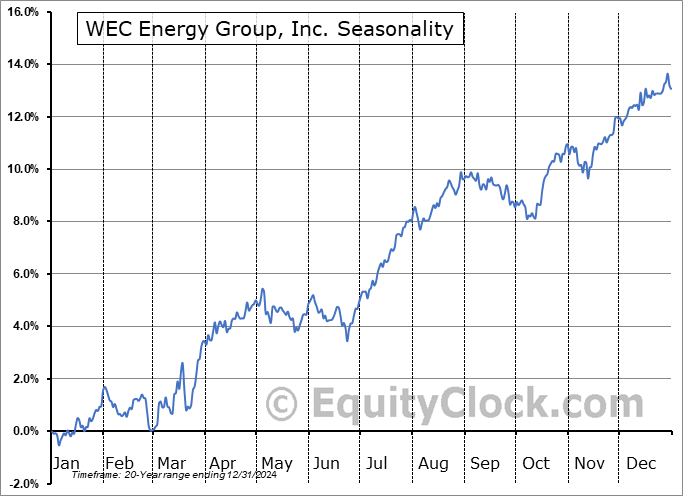
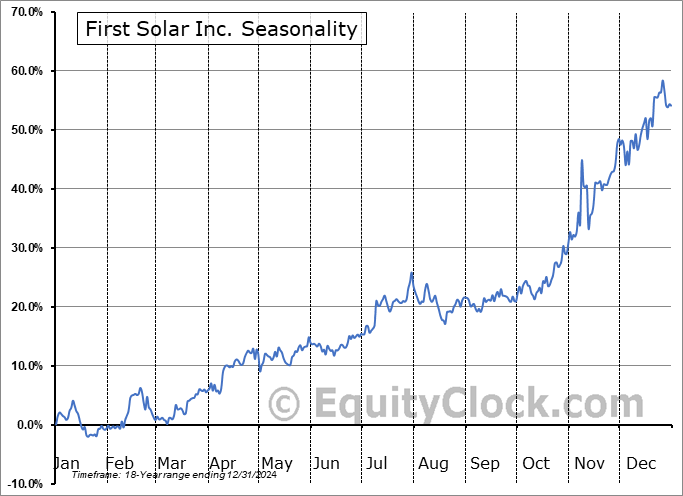
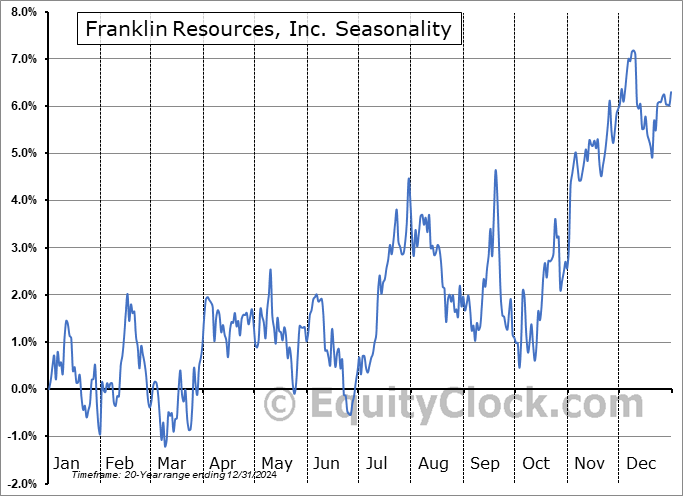
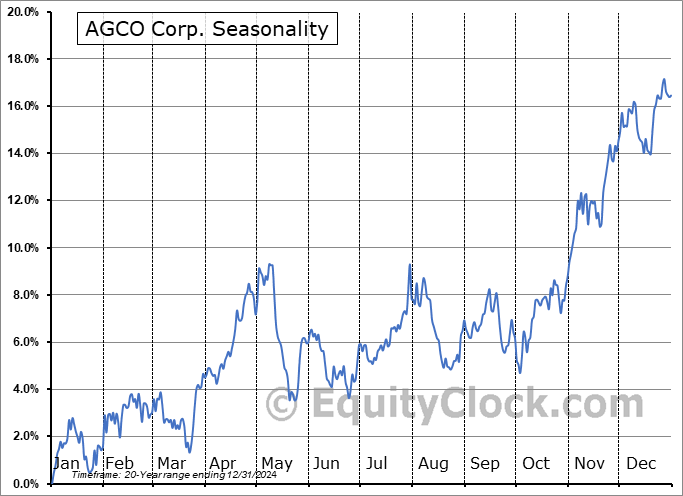
Seasonal charts of companies reporting earnings today:
S&P 500 Index
TSE Composite
| Sponsored By... |

|


