Stock Market Outlook for November 1, 2023

November is the first of the best six months of the year timeframe for the equity market. The S&P 500 Index has averaged a gain of 1.8% in this second to last month of the year.
*** Stocks highlighted are for information purposes only and should not be considered as advice to purchase or to sell mentioned securities. As always, the use of technical and fundamental analysis is encouraged in order to fine tune entry and exit points to average seasonal trends.
Stocks Entering Period of Seasonal Strength Today:
Subscribers Click on the relevant link to view the full profile. Not a subscriber? Signup here.

Aviat Networks Inc. (NASD:AVNW) Seasonal Chart

iShares Morningstar Small-Cap Growth ETF (NYSE:ISCG) Seasonal Chart

Ethan Allen Interiors Inc. (NYSE:ETD) Seasonal Chart

iShares MSCI Italy Capped ETF (NYSE:EWI) Seasonal Chart

Super Micro Computer, Inc (NASD:SMCI) Seasonal Chart

Trinity Industries Inc. (NYSE:TRN) Seasonal Chart
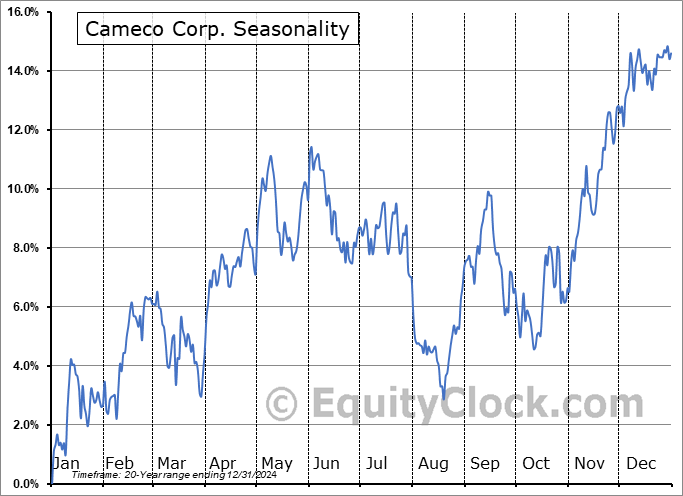
Cameco Corp. (TSE:CCO.TO) Seasonal Chart

International Paper Co. (NYSE:IP) Seasonal Chart
The Markets
Stocks edged higher in the Halloween session as investors attempt to shake off the jitters pertaining to the threat of a recession and ongoing geopolitical turmoil. The S&P 500 Index closed higher by just less than two-thirds of one percent, continuing to rebound from oversold territory that was charted into the end of last week. Investors continue to make a stand at the significant band of support between 4100 and 4200, attempting to keep the positive intermediate path stemming from last October’s low intact heading into the best six months of the year for stocks that kicks off in a big way in November. Major moving averages remain in a position of resistance overhead, including the 50 and 200-day at 4353 and 4242, respectively. Momentum indicators are starting to curl higher, producing what continues to look like a positive divergence versus price, indicative of waning selling pressures. The risk-reward to accumulating equity exposure around present levels remains highly enticing heading into the seasonally favourable timeframe ahead.

Looking towards the month ahead, November is the first of the best six months of the year for stocks that runs through the spring of the following year and seeking to increase risk exposure is typically prudent to gain exposure to the positive seasonal bias. The S&P 500 Index has averaged a return of 1.8% for November with 75% of periods showing positive results in the past two decades. Combined with the month of December, the best consecutive two month span of the year for stocks can be seen, fuelled by the chase for performance into the end of the year, generally upbeat investor sentiment, and the flow of spending in the economy as consumers purchase goods for the holiday season. We breakdown everything that we are looking at for the month(s) ahead in our just released monthly outlook for November.


Just released…
Our monthly report for November is out, providing you with everything that you need to know heading into the month(s) ahead.
Highlights in this report include:
- Equity market tendencies in the month of November
- Pre-election year tendencies for stocks positive into year-end
- New evidence of upside exhaustion in rates
- Beware the bear-steepener
- Macro-fundamental data has yet to suggest a recession is imminent
- High yield spreads not yet indicative of strains in the economy
- Don’t fight the Fed
- Coincident indicators not yet indicative of an imminent downturn, but manufacturers remain pessimistic
- Copper
- Goods producing employment on the decline in Canada as a result of the manufacturing downturn
- The average toll on stocks during recessionary years
- Commodities in focus
- US Dollar
- When the market is fearful, investors are best to be greedy
- Positioning and sentiment
- High cost of borrowing weighing on the housing market following early year strength
- Inflationary pressures alleviating, but not in the core-necessities of life
- Don’t expect much from Agriculture stocks this fall
- Poor Breadth
- Our list of all segments of the market to either Accumulate or Avoid, along with relevant ETFs
- Positioning for the months ahead
- Sector Reviews and Ratings
- Stocks that have Frequently Gained in the Month of November
- Notable Stocks and ETFs Entering their Period of Strength in November
Subscribers can look for this 115-page report in their inbox and, soon, in the report archive.
Not subscribed yet? Signup now to receive access to this report and all of the research that we publish.
With the new month upon us and as we celebrate the release of our monthly report for November, today we release our screen of all of the stocks that have gained in every November over their trading history. While we at Equity Clock focus on a three-pronged approach (seasonal, technical, and fundamental analysis) to gain exposure to areas of the market that typically perform well over intermediate (2 to 6 months) timeframes, we know that stocks that have a 100% frequency of success for a particular month is generally of interest to those pursuing a seasonal investment strategy. Below are the results:

And how about those securities that have never gained in this eleventh month of the year, here they are:

*Note: None of the results highlighted above have the 20 years of data that we like to see in order to accurately gauge the annual recurring, seasonal influences impacting an investment, therefore the reliability of the results should be questioned. We present the above list as an example of how our downloadable spreadsheet available to yearly subscribers can be filtered.
Today, in our Market Outlook to subscribers, we discuss the following:
- Monthly look at the large-cap benchmark
- Tendency for the S&P 500 Index in the month of November
- All of the securities that have gained or lost in every November over their trading history
- Home Prices in the US
- Canada Gross Domestic Product (GDP)
Subscribers can look for this report in their inbox or by clicking on the following link and logging in: Market Outlook for November 1
Not signed up yet? Subscribe now to receive full access to all of the research and analysis that we publish.
Sentiment on Tuesday, as gauged by the put-call ratio, ended bearish at 1.09.

Seasonal charts of companies reporting earnings today:


 Seasonal Chart")


 Seasonal Chart")


 Seasonal Chart")


S&P 500 Index


TSE Composite


| Sponsored By... |

|


