Stock Market Outlook for November 6, 2023

False breakdowns among bonds and stocks in recent weeks have shaken the bearish resolve in the market.
*** Stocks highlighted are for information purposes only and should not be considered as advice to purchase or to sell mentioned securities. As always, the use of technical and fundamental analysis is encouraged in order to fine tune entry and exit points to average seasonal trends.
Stocks Entering Period of Seasonal Strength Today:
Subscribers Click on the relevant link to view the full profile. Not a subscriber? Signup here.

Viatris Inc. (NASD:VTRS) Seasonal Chart

Canterbury Park Holding Corp. (NASD:CPHC) Seasonal Chart

VanEck Vectors Pharmaceutical ETF (NASD:PPH) Seasonal Chart

iShares U.S. Healthcare ETF (NYSE:IYH) Seasonal Chart

Boston Properties, Inc. (NYSE:BXP) Seasonal Chart

Axcelis Technologies, Inc. (NASD:ACLS) Seasonal Chart

Teradata Corp. (NYSE:TDC) Seasonal Chart

J.B. Hunt Transport Services, Inc. (NASD:JBHT) Seasonal Chart

BlackBerry (TSE:BB.TO) Seasonal Chart

Ag Growth International Inc. (TSE:AFN.TO) Seasonal Chart

Fidelity MSCI Telecommunication Services Index ETF (AMEX:FCOM) Seasonal Chart

iShares MSCI EAFE Index ETF (CAD-Hedged) (TSE:XIN.TO) Seasonal Chart

Hormel Foods Corp. (NYSE:HRL) Seasonal Chart

Dynex Capital, Inc. (NYSE:DX) Seasonal Chart
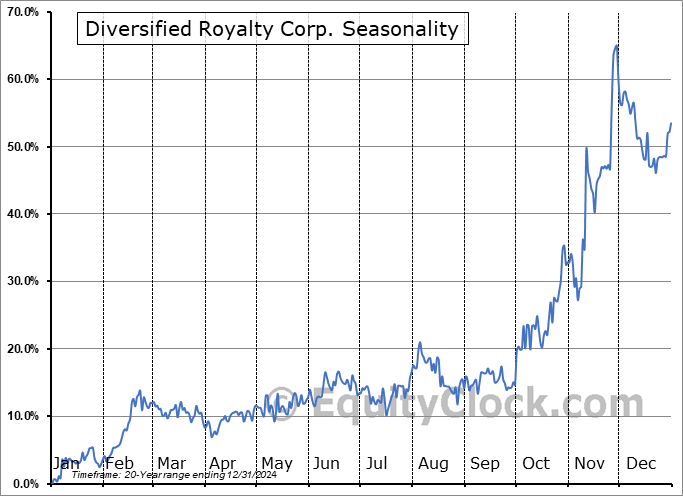
Diversified Royalty Corp. (TSE:DIV.TO) Seasonal Chart

Allied Properties Real Estate Investment Trust (TSE:AP/UN.TO) Seasonal Chart

Sonoco Products Co. (NYSE:SON) Seasonal Chart

ACI Worldwide Inc. (NASD:ACIW) Seasonal Chart

Gildan Activewear, Inc. (TSE:GIL.TO) Seasonal Chart

Enbridge, Inc. (TSE:ENB.TO) Seasonal Chart
The Markets
Stocks rose again on Friday to cap of the strongest week of the year for equity market performance, providing a stellar jump out of gate for the best six months of the year trade that runs between October 27th and May 5th. The S&P 500 Index closed with a gain of just over nine-tenths of one percent, moving above intermediate resistance at the declining 50-day moving average around 4350. The declining trend channel that spanned the past three months has been cracked, providing the setup for higher values into year-end, coinciding with positive end-of-year seasonality. The next level of significance on the upside is 4400, representing the hurdle that the benchmark peaked around in the middle of October. Downside hurdles in a position to support the market are now the 20 and 50-day moving averages, as well a this week’s upside gaps at 4320 and 4240. We have been persistent with our view that the risk-reward to accumulating stocks around the band of support between 4100 and 4200 and the performance this past week has proven that. The positive divergences with respect to MACD and RSI have taken these momentum indicators off of their negative paths that provided a bearish look to the market between the end of July and the start of October and a bullish bias is the prudent approach until the market can definitively show greater evidence of resistance than support over an intermediate timeframe; the intermediate path stemming from the low charted in October of 2022 remains that of higher-highs and higher-lows and a break of the short-term trend above 4400 would confirm this path remains intact.

Today, in our Market Outlook to subscribers, we discuss the following:
- Weekly look at the large-cap benchmark
- Bonds
- Investor positioning and sentiment
- US Employment Situation and the investment themes that the data suggests are favourable
- Wages
- Canada Labour Force Survey and the strong rise of unemployment
Subscribers can look for this report in their inbox or by clicking on the following link and logging in: Market Outlook for November 6
Not signed up yet? Subscribe now to receive full access to all of the research and analysis that we publish.
Sentiment on Friday, as gauged by the put-call ratio, ended slightly bullish at 0.92.

Seasonal charts of companies reporting earnings today:


S&P 500 Index


TSE Composite


| Sponsored By... |

|


