Stock Market Outlook for November 7, 2023

Short-term seasonal norms suggest a digestion of early November strength until the weeks surrounding the US Thanksgiving holiday.
*** Stocks highlighted are for information purposes only and should not be considered as advice to purchase or to sell mentioned securities. As always, the use of technical and fundamental analysis is encouraged in order to fine tune entry and exit points to average seasonal trends.
Stocks Entering Period of Seasonal Strength Today:
Subscribers Click on the relevant link to view the full profile. Not a subscriber? Signup here.

Vanguard FTSE Developed All Cap ex U.S. Index ETF (CAD-hedged) (TSE:VEF.TO) Seasonal Chart

iShares Edge MSCI Min Vol USA Index ETF (TSE:XMU.TO) Seasonal Chart

WisdomTree MidCap Dividend Fund (NYSE:DON) Seasonal Chart
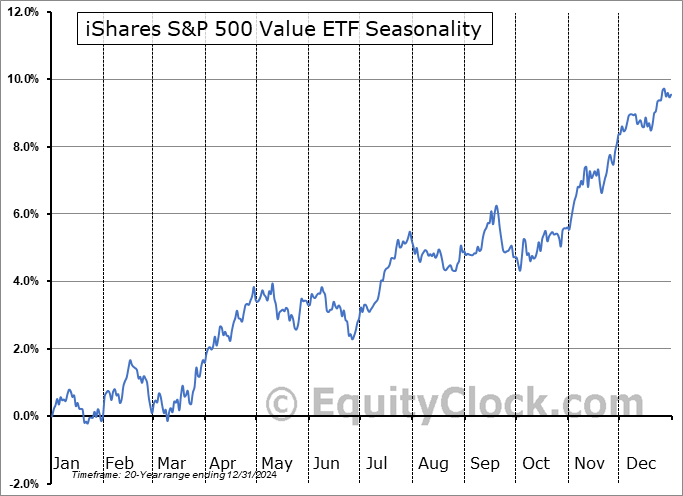
iShares S&P 500 Value ETF (NYSE:IVE) Seasonal Chart

iShares Russell 1000 Value ETF (NYSE:IWD) Seasonal Chart

Vanguard Small-Cap Value ETF (NYSE:VBR) Seasonal Chart

Vanguard Value ETF (NYSE:VTV) Seasonal Chart

Vanguard Russell 2000 Growth ETF (NASD:VTWG) Seasonal Chart

SPDR S&P Telecom ETF (NYSE:XTL) Seasonal Chart

Orion Energy Systems Inc. (NASD:OESX) Seasonal Chart

Masco Corp. (NYSE:MAS) Seasonal Chart

Louisiana Pacific Corp. (NYSE:LPX) Seasonal Chart

Teva Pharmaceutical Industries Ltd. (NYSE:TEVA) Seasonal Chart

Jazz Pharmaceuticals, Inc. (NASD:JAZZ) Seasonal Chart

Summit Hotel Properties Inc. (NYSE:INN) Seasonal Chart
The Markets
Stocks closed mildly higher on Monday as investors digested the strong gains from the past week. The S&P 500 Index added just less than two-tenths of one percent, attempting to hold levels above the 50-day moving average that was broken as resistance last week. While the benchmark has been inching above many of the major moving averages that threatened to cap any advance from the recent lows, we can see that price has merely found its way into this cloud of potential resistance and there is still quite a bit of work to do in order to redefine these hurdles as levels of support, as has been the case for much of this year. Moving averages are evolving from a state of expansion relative to one another to a state of contraction where the spreads are converging as momentum wanes. Historically, some of the best times to buy stocks have been realized when the spreads between major moving averages are narrow and they act as positions of support before they start expanding, while some of the poorer times to get involved are when spreads are wide and starting to narrow, as looks to be the case now. The big zone for the S&P 500 Index remains the band of significant support between 4100 and 4200 and, as long as the benchmark remains above this threshold, investors can find ways to be constructive on the long-side of the large-cap benchmark.

Want to know which areas of the market to buy or sell? Our Weekly Chart Books have just been updated, providing a clear Accumulate, Avoid, or Neutral rating for currencies, cryptocurrencies, commodities, broad markets, and subsectors/industries of the market. Subscribers can login and click on the relevant links to access.
- Currencies
- Cryptocurrencies
- Commodities
- Major Benchmarks
- Sub-sectors / Industries
- ETFs: Bonds | Commodities | Equity Markets | Industries | Sectors
Subscribe now.
Today, in our Market Outlook to subscribers, we discuss the following:
- Our weekly chart books update along with our list of all segments of the market to either Accumulate or Avoid
- Small Caps
- Canadian Venture Composite Index
- The High Beta ETF (SPHB)
Subscribers can look for this report in their inbox or by clicking on the following link and logging in: Market Outlook for November 7
Not signed up yet? Subscribe now to receive full access to all of the research and analysis that we publish.
Sentiment on Monday, as gauged by the put-call ratio, ended bearish at 1.16.

Seasonal charts of companies reporting earnings today:


 Seasonal Chart")


S&P 500 Index


TSE Composite


| Sponsored By... |

|


