Stock Market Outlook for November 8, 2023

The price of oil is presently within its weakest time of year, but the pullback that is being realized provides the opportunity to buy into weakness.
*** Stocks highlighted are for information purposes only and should not be considered as advice to purchase or to sell mentioned securities. As always, the use of technical and fundamental analysis is encouraged in order to fine tune entry and exit points to average seasonal trends.
Stocks Entering Period of Seasonal Strength Today:
Subscribers Click on the relevant link to view the full profile. Not a subscriber? Signup here.

iShares MSCI Europe IMI Index ETF (TSE:XEU.TO) Seasonal Chart

RBC Quant U.S. Dividend Leaders ETF (TSE:RUD.TO) Seasonal Chart

iShares JPX-Nikkei 400 ETF (AMEX:JPXN) Seasonal Chart

SPDR S&P Homebuilders ETF (NYSE:XHB) Seasonal Chart

Vanguard S&P 500 Value ETF (NYSE:VOOV) Seasonal Chart

Invesco S&P 500 Equal Weight Financials ETF (NYSE:RYF) Seasonal Chart

Invesco S&P 500 Equal Weight ETF (NYSE:RSP) Seasonal Chart

TC Energy Corporation (TSE:TRP.TO) Seasonal Chart

iShares MSCI Japan ETF (NYSE:EWJ) Seasonal Chart

iShares Canadian Government Bond Index ETF (TSE:XGB.TO) Seasonal Chart

iShares Core MSCI EAFE IMI Index ETF (TSE:XEF.TO) Seasonal Chart
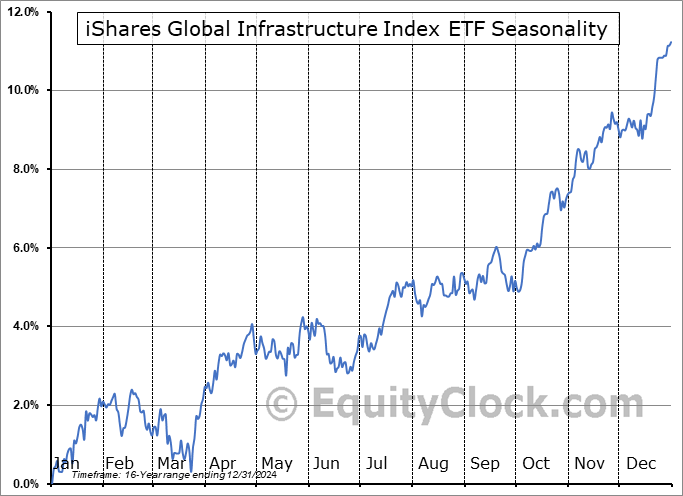
iShares Global Infrastructure Index ETF (TSE:CIF.TO) Seasonal Chart
The Markets
Stocks closed generally mixed on Tuesday as core cyclical sectors came under pressure amidst weak data out of China. The S&P 500 Index added just less than three-tenths of one percent, pushing up towards horizontal resistance and the 100-day moving average at 4400. The benchmark remains in the midst of this cloud of moving averages and a convergence within has been materializing, underlining our concerns pertaining to the sustainability of the strength in stocks through the months ahead. The horizontal band of support between 4100 and 4200 remains vitally important to the intermediate-term trend, without it a move back to the band of support that the benchmark rebounded from in the spring between 3600 and 3800 may be in the cards. Both MACD and RSI have broken their declining trends that had been in place since July, providing hope for the same outcome for price as the markets gets further into this normal year-end rally period through November and December. Seasonally, beyond the start of November thrust higher in stock prices, a digestion of the gains is normal through the middle of the month until the period surrounding the US Thanksgiving holiday.

Today, in our Market Outlook to subscribers, we discuss the following:
- The abrupt decline in commodity prices and the seasonal weakness in Oil
- Commodity Tracking Fund
- US International Trade
- Canadian Merchandise Trade
- Canadian stocks
- Materials Sector
Subscribers can look for this report in their inbox or by clicking on the following link and logging in: Market Outlook for November 8
Not signed up yet? Subscribe now to receive full access to all of the research and analysis that we publish.
Sentiment on Tuesday, as gauged by the put-call ratio, ended Neutral at 0.98.

Seasonal charts of companies reporting earnings today:
 Seasonal Chart")


 Seasonal Chart")


S&P 500 Index


TSE Composite


| Sponsored By... |

|


